Shutting off gas will drive up costs
More than five million Australian homes and businesses are connected to natural gas.
Nationally, the gas supplied through these networks provides an average of 44 per cent of the total energy consumed in homes.
During winter, natural gas provides more than double the energy of electricity. In Canberra, it’s more like three times.
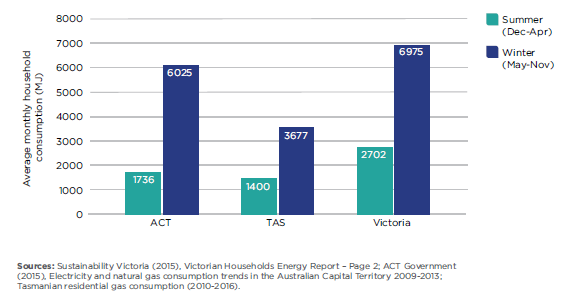
Figure 1: Comparison of residential gas demand in summer and winter
Phasing out gas means you need the ACT’s electricity system to deliver up to four times the electrons it currently delivers in winter. More generation and more grid capacity will be required.
This is expensive. Really expensive.
It appears the ACT Government has decided it’s a good idea to phase out gas without considering, in any detail, the impact on power bills.
Currently, 85 per cent of ACT households are on the gas network. Canberra gas connections have grown at about two per cent per year. Most Canberrans rely on gas for heating and cooking.
One key reason for this is gas heating is seen as superior to reverse-cycle electric heating in places where the mercury regularly drops below zero – like the ACT.
If gas is turned off, it would require a significant build-out of new electricity infrastructure to replace the capacity that’s already there in the gas network.
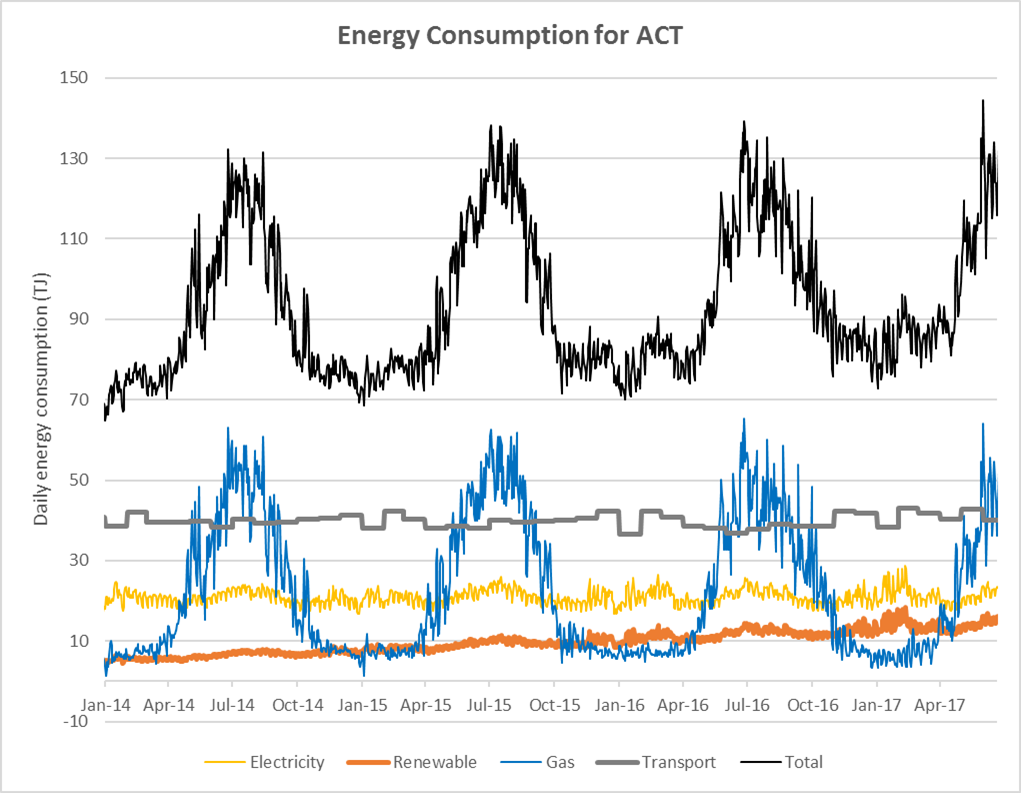
Figure 2: Energy consumption in the ACT[1]
It’s important to note that Energy Networks Australia represents both electricity and gas distribution networks. Our members are the ones who would build and operate new electricity networks as well as the existing gas distribution networks.
Our primary interest is an energy system that delivers for our customers. One where the gas and electricity grids work together to continue to deliver reliable, secure energy in tandem with cost-effective carbon reduction.
We do not support policies that drive additional investment in electricity networks simply to replace gas. It’s a lose-lose for customers – they have to pay more for electricity infrastructure and they don’t get any benefit from the gas infrastructure they have already paid for.
This gas infrastructure is already built. It’s already in the ground and it has the potential to deliver clean energy. In Canberra, the gas grid is relatively new and has many years of life left in it.
The ACT Government said it wants to “Copenhagenise” the city. It may have missed the memo that Copenhagen has done the opposite of phasing out gas; in fact, it has a strong gas focus.
Copenhagen is going through a transition to upgrade its gas to carbon-neutral biogas with the aim to achieve 100 per cent biogas by 2025. In June 2019, 44 per cent of Copenhagen’s gas supply was already carbon-neutral gas.
The smarter and more efficient pathway is to decarbonise our gas networks by looking to alternate sources such as hydrogen and biogas.
Hydrogen can be produced from excess renewable energy. There are times during the day that we have too much solar or wind energy.
If there is too much generation, most is simply wasted, as seen by the number of times the electricity spot price was below zero in the past month. This excess energy could be converted into hydrogen and stored in the existing gas infrastructure for later use.
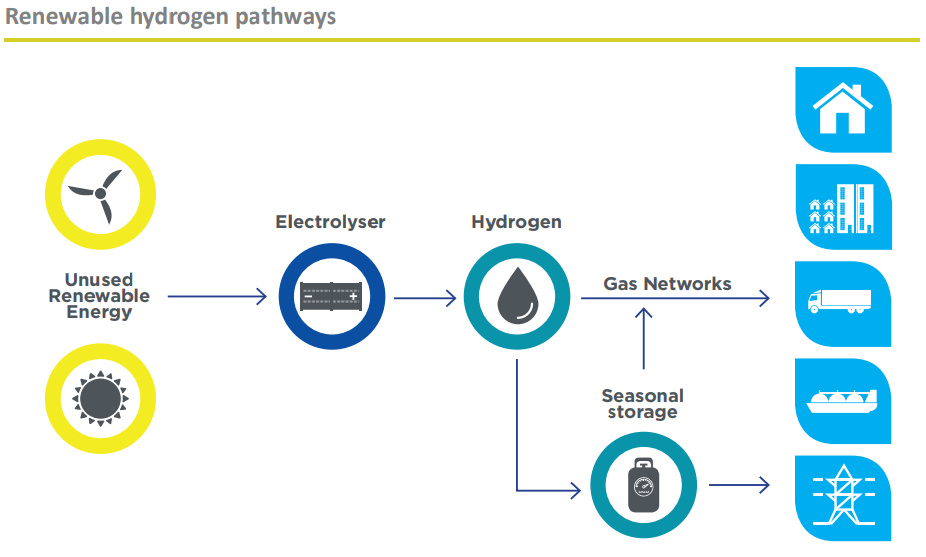
Figure 3: Hydrogen pathways
The Gas Vision 2050 report by Energy Networks Australia showed that Australia’s gas infrastructure already has the same energy storage potential as six billion Tesla PowerWall batteries – equal to 250 for each Australian. This is already built and can be used to run businesses, heat homes and water and cook food.
Australia’s gas networks, including Evoenergy in the ACT, are already testing the blending of hydrogen into existing distribution networks to provide clean, efficient energy to heat homes and cook food.
Plans are also underway to transition entire networks to hydrogen.
We need to be looking at smarter ways to decarbonise and build a sustainable energy grid.
Phasing out the emissions from our gas grid makes sense. Phasing out gas will lead to ACT customers paying more for their energy.
References
[1] Source: Energy Networks Australia analysis based on AEMO data and Australian Petroleum Statistics.

