Network Opportunity Maps helping to build the distributed energy resources market
Network Opportunity Maps (NOMs) of Australia’s electricity grid identify the most valuable locations for investment in renewable energy and demand management across the grid.
The Institute for Sustainable Futures (ISF) at the University of Technology Sydney (UTS) led development of the interactive maps to consolidate information on current and future capacity constraints in electricity network infrastructure across Australia based on network planning report data.
The first full, interactive iteration of the maps is now available and includes spatial data from all electricity Network Service Providers (NSPs) on network constraints, planned investment and the potential value of distributed energy resources in networks across the Australian National Electricity Market (NEM).
The maps will make it easier for NSPs, their customers, and proponents of non-network alternatives to network investment to develop a common understanding of the potential value of reducing peak electricity demand in different parts of the network. By consolidating information, the project aims to build the market for distributed energy resources and reduce costs for all customers.
The maps offer value to NSPs by easily identifying opportunities for avoiding planned network investment and reducing reliance on investments with 40-year lifespans. They also:
- Prepare network businesses for the new collaborative era of grid management, supporting interactions with many third party service providers;
- Allow network businesses to communicate with stakeholders about technical grid development plans in an accessible way; and
- Provide potential for streamlining the reporting requirements of the Annual Planning Reports (APR) through a consistent mapping approach.
Importantly, the maps can assist non-network service providers to identify opportunities for developing distributed generation and storage and other non‑network solutions. The opportunities from the maps will assist in transforming the network, as described by the Energy Networks Association’s and CSIRO’s Electricity Network Transformation Roadmap project.
Figure 1 below is a screen shot from the NOMs showing available capacity on the electricity network around Port Phillip Bay in Victoria and potential areas of constraint.
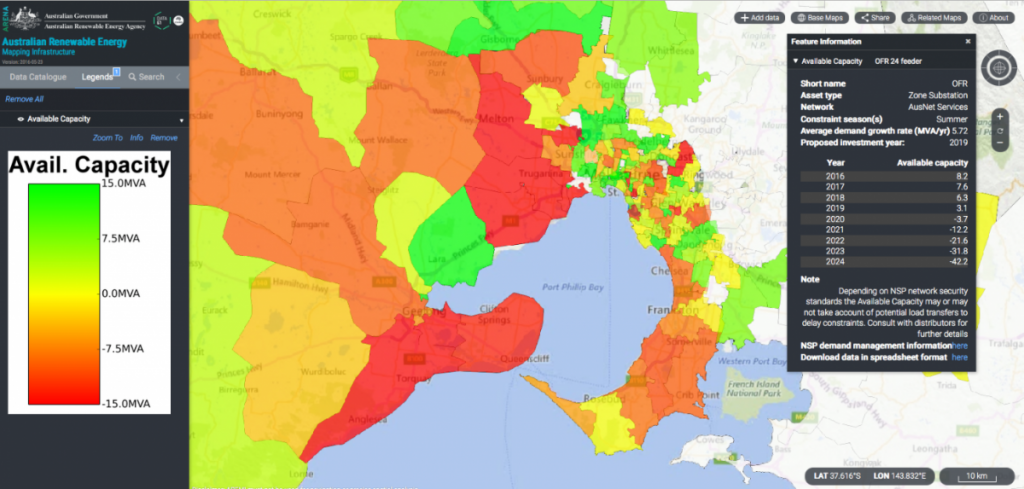
Figure 1 – A screenshot from the NOM showing Available Capacity
In addition to network capacity, the NOMs also highlight areas of proposed investment (as shown in Figure 2 below). By installing distributed energy resources or implementing a non-network solution, it may be possible for the proposed network investment to be deferred. Figure 3 (below) illustrates the Annual Deferred Value that can be achieved by avoiding network investment.
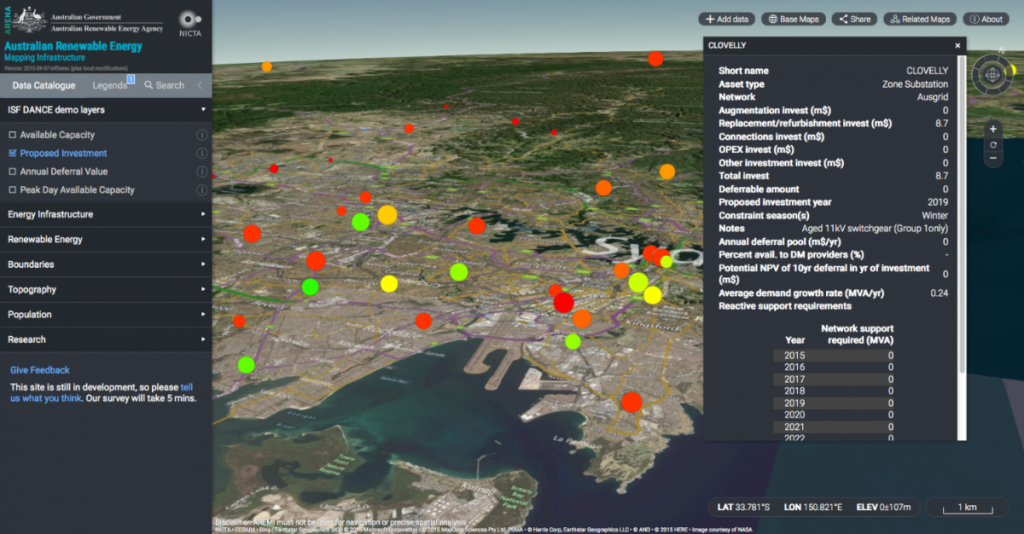
Figure 2 – A screenshot from the NOM showing Proposed Investment
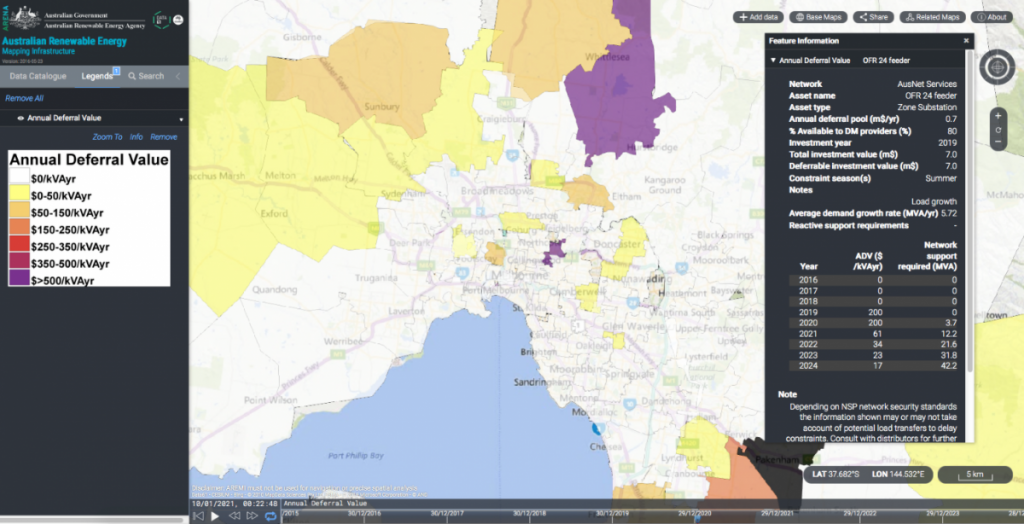
Figure 3 – A screenshot from the NOM showing the Annual Deferred Value
Development of the NOM
The three‑year project to develop the maps received assistance under the ARENA Emerging Renewables program. Funding and in‐kind support was provided by the NSW Department of Industry, Ergon Energy (now Energy Queensland), UTS, TransGrid, and ElectraNet.
The project has been guided by a Strategic Reference Group, which included representatives from:
- The Australian Energy Market Operator (AEMO);
- The Australian Energy Regulator (AER);
- The Australian Renewable Energy Agency (ARENA);
- The Department of Industry (DOI);
- The Energy Networks Association; and
- Network operators, Transgrid, ElectraNet, Ausgrid, Ergon Energy, Energex and United Energy.
All NSPs operating in the Australian electricity market provided data to populate the maps.
Data for the Maps
The majority of data presented in the Network Opportunity Maps already exists in the NSP’s APRs, although it is presented in varying forms. For the maps to become an effective part of network businesses’ demand side engagement frameworks, it is important that NSPs provide the required data in a standardised format on an ongoing basis to allow the maps to be updated annually.
The Energy Networks Association and its members are working with the ISF to develop a guideline and template for the standardised collection of the data required for the annual update. Energy networks from around Australia will be able to use the template to provide the information required to keep the maps up to date.
The DANCE Model
The NOMs project uses the Dynamic Avoidable Network Cost Evaluation (DANCE) model developed by the ISF as part of the Intelligent Grid Research Program. The ISF previously applied the DANCE model to mapping Decentralised Energy for Victoria and to rural areas of the NEM suitable for concentrating solar power in Breaking The Solar Gridlock. These previous versions of the DANCE model involved time-intensive manual processes, which have now been successfully streamlined through the NOM project.
Accessing the NOM
To access the Network Opportunity Maps:
- Go to the Australian Renewable Energy Mapping Infrastructure (AREMI) web portal.
- Click ‘Add Data’, then select ‘Electricity Infrastructure’ and ‘Network Opportunities – ISF’.
- Select a Network Opportunity Maps layer, either:
- Available Distribution Capacity
- Proposed Investment
- Annual Deferral Value
- Peak Day Available Capacity
- Move time slider along the bottom of the screen to scroll through the years from 2015 to 2024 (for Available Distribution Capacity or Annual Deferral Value) or hours of the day (for Peak Day Available Capacity).
- To view another Network Opportunity Maps layer, click ‘Add Data’ again, deselect the current layer and select a new layer. (It is best to avoid using multiple layers at once.)
Map Demonstration Webinar
The ISF is hosting a webinar on 3 August, 2016 from 2pm to 3.30pm to demonstrate how the maps work and what they show. Participants will be able to ask questions about the maps. Register for the webinar here.
Further information about the NOMs can be found at the ISF’s NOM project website.


