Network constraints: challenge or opportunity?
The smart integration of renewable energy with the grid is the key energy market and asset management opportunity and challenge of a generation.
The growth of distributed energy resources (DERs) poses some challenges for networks, but they also provide a valuable resource for networks, with great potential to promote efficiency, reduce long-term costs and support the development of a more dynamic energy marketplace as energy resources are traded across the system.
One of the key requirements to deliver this capability is the development of tools and platforms that share network information clearly with customers and the market.
A first step towards a more dynamic energy market place, supported by network platforms is the newly updated Network Opportunity Maps. These interactive maps of the Australian electricity grid are designed to support the integration of a growing range of DER providing cleaner, localised energy solutions.
The Network Opportunity Maps identify the most valuable locations for investment in renewable energy and demand management across the grid. It is the culmination of a three-years’ work by the Institute for Sustainable Futures (ISF) at UTS, with Energy Networks Australia, ARENA, the NSW Government, CSIRO and industry partners including Ergon Energy, AusNet Services, Powerlink, ElectraNet and Transgrid.
The ambition of the maps is to help to build a smarter, more reliable and efficient grid. The maps include: spatial data from all electricity Network Service Providers (NSPs) on network constraints; planned investment and the potential value of integrating distributed energy resources with networks across the Australian National Electricity Market (NEM).
The Network Opportunity Maps support two key market challenges:
- Identifying opportunities for non-network alternative solutions and services to networks
- Indicating the capacity of the network to support new renewable generation sources
Non-Network alternative services and solutions markets
The maps make it easier for energy networks to indicate to customers and the market where upcoming investment in the grid is required. As networks act to implement the most efficient solution for network augmentations, the Network Opportunity Maps support continued growth in the non-network solutions market by making the potential value of reducing peak electricity demand more visible. By consolidating this information in an interactive manner, the maps aim to support the development of a market for DERs. In the long term this will result in reduced costs for customers as networks utilise the growing number of customer DER services as an alternative to traditional network investment. This growing market is forecast to be worth $1.4 billion in avoided network investment nationally by 2027
However for this market to develop, transparent information is essential so participants can engage with networks on early areas of opportunity. The maps provide a platform from which this can begin. The lessons from these first steps will pave the way for the development of more sophisticated DER services markets and solutions into the future.
The maps help by easily identifying opportunities for avoidable network investment and reducing reliance on capital intensive investments with 40-year lifespans.
The Network Opportunity Maps highlight areas of proposed energy network investment (Figure 1). By implementing a non-network solution such as utilising available local DERs, it may be possible for the proposed network investment to be deferred or avoided altogether.
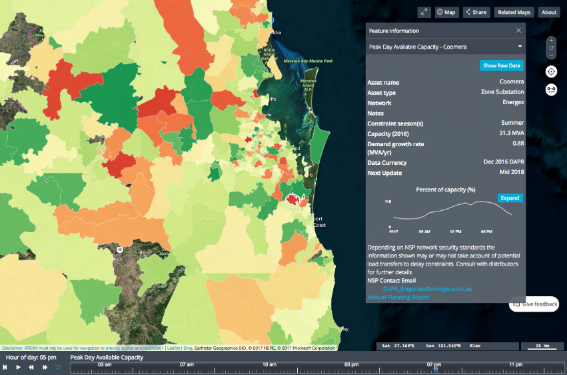
Figure 1: Peak day load curve information for most zones and constrained network assets in the National Electricity Market. For more detail click here
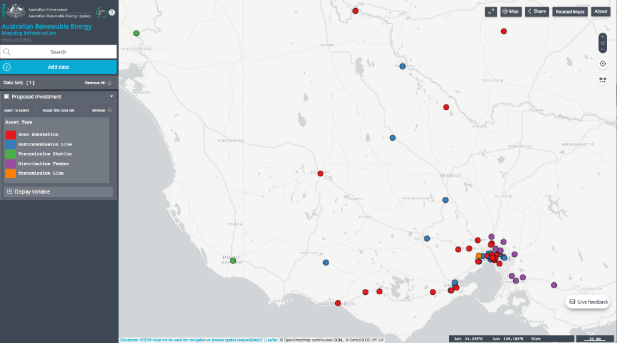
Figure 2: New visualisation of proposed network investment visualisation according to constraint season, investment driver and asset type. For more detail click Click here
The maps are also updated to cover the load forecast and investment planning period Winter 2016- Summer 2025/26 (current to Annual Planning Reports of December 2016 for distribution and July 2017 for Transmission) and networks constrainst data (Figure 3)
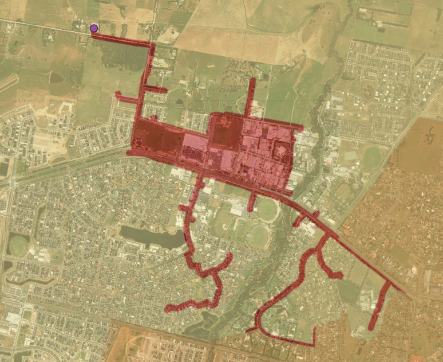
Figure 3: Constraint data down to the distribution feeder level for AusNet Services (eastern Victoria) For more detail click here
Indicating the capacity of the network to support new renewable generation sources at different locations
The Network Opportunity Maps include the latest network investment and load forecast data, and indicate how much new generation – such as new solar and wind farms – can be connected in each area.
This is a valuable tool for project proponents looking for opportunities to connect new generation sources at different points across networks. The maps provide an interactive tool that can be used to assess the local capacity of networks to host new generation sources. This information may help speed up connection enquiries and identify potential local technical issues before a formal connection request is made and help facilitate the growing renewables marketplace by making important network information more readily available.
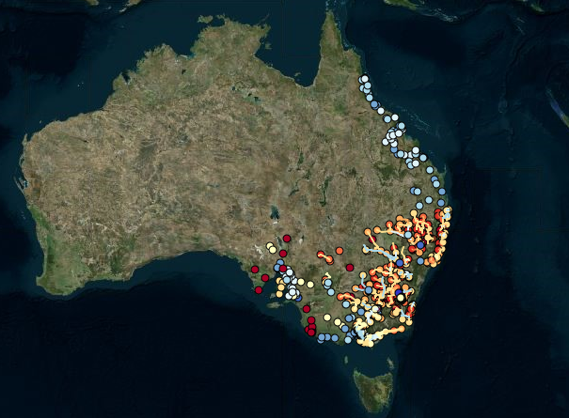
Figure 4: New “generation connection opportunities” layers showing the indicative capacity of the network to accept new distributed power plants. For more detail click here
Data for the Maps
The majority of data presented in the NOM already exists in the network annual planning reports, but makes this data more visible and meaningful. A critical objective of networks supporting these maps is to provide required data in a standardised format on an ongoing basis to allow the maps to be updated annually.
The first comprehensive versions of the Network Opportunity Maps, was released on 27th July 2016, and updated with transmission data in January 2017, include complete geographic datasets for all network businesses in the Australian National Electricity Market (NEM). These new maps update and improve on the Sample Maps released in 2015.
Accessing the Network Opportunity Maps

The Network Opportunity Maps are now available on the Australian Renewable Energy Mapping Infrastructure (AREMI) site: http://nationalmap.gov.au/renewables/ .
To access the Network Opportunity Maps:
- Go to the Australian Renewable Energy Mapping Infrastructure (AREMI) web portal.
- Click ‘Add Data’, then select ‘Electricity Infrastructure’ and ‘Network Opportunities’.
- Select a Network Opportunity Maps layer from the following:
- Available Distribution Capacity
- Proposed Investment
- Annual Deferral Value
- Peak Day Available Capacity
- Generator Connection Capacity
- Move time slider along the bottom of the screen to scroll through the years from 2017 to 2025 (for Available Distribution Capacity or Annual Deferral Value) or hours of the day (for Peak Day Available Capacity).
- To view another Network Opportunity Maps layer, click ‘Add Data’ again, deselect the current layer and select a new layer. (It is best to avoid using multiple layers at once.)
Webinar briefing
On 2 November 2017 Energy Networks Australia and ISF hosted a webinar briefing on the updates to the Network Opportunity Maps including New “generation connection opportunities” layers showing the indicative capacity of the network to accept new distributed power plants.

