What’s in a nanoleak? Not much…
Producing and transporting gas to customers involves pipelines and gas distribution networks. Some of the gas that is produced is used to power compressors to move the gas along the pipelines, or also used in water baths where the high-pressure gas from pipelines is reduced to lower pressure gas that can be delivered to customers.
Similar to a water hose, some of the gas can leak from the fittings. It is uncommon for water hoses to leak in the tubular component but they often leak from the fittings. The same is true for gas. There is generally no leakage from the actual pipe material although leakage can occur where the pipe is joined or connected to the fitting. Leakage through the actual pipe, for example a puncture, would be easily identifiable as it would release a lot of gas, and subsequently would be simple to locate and repair.
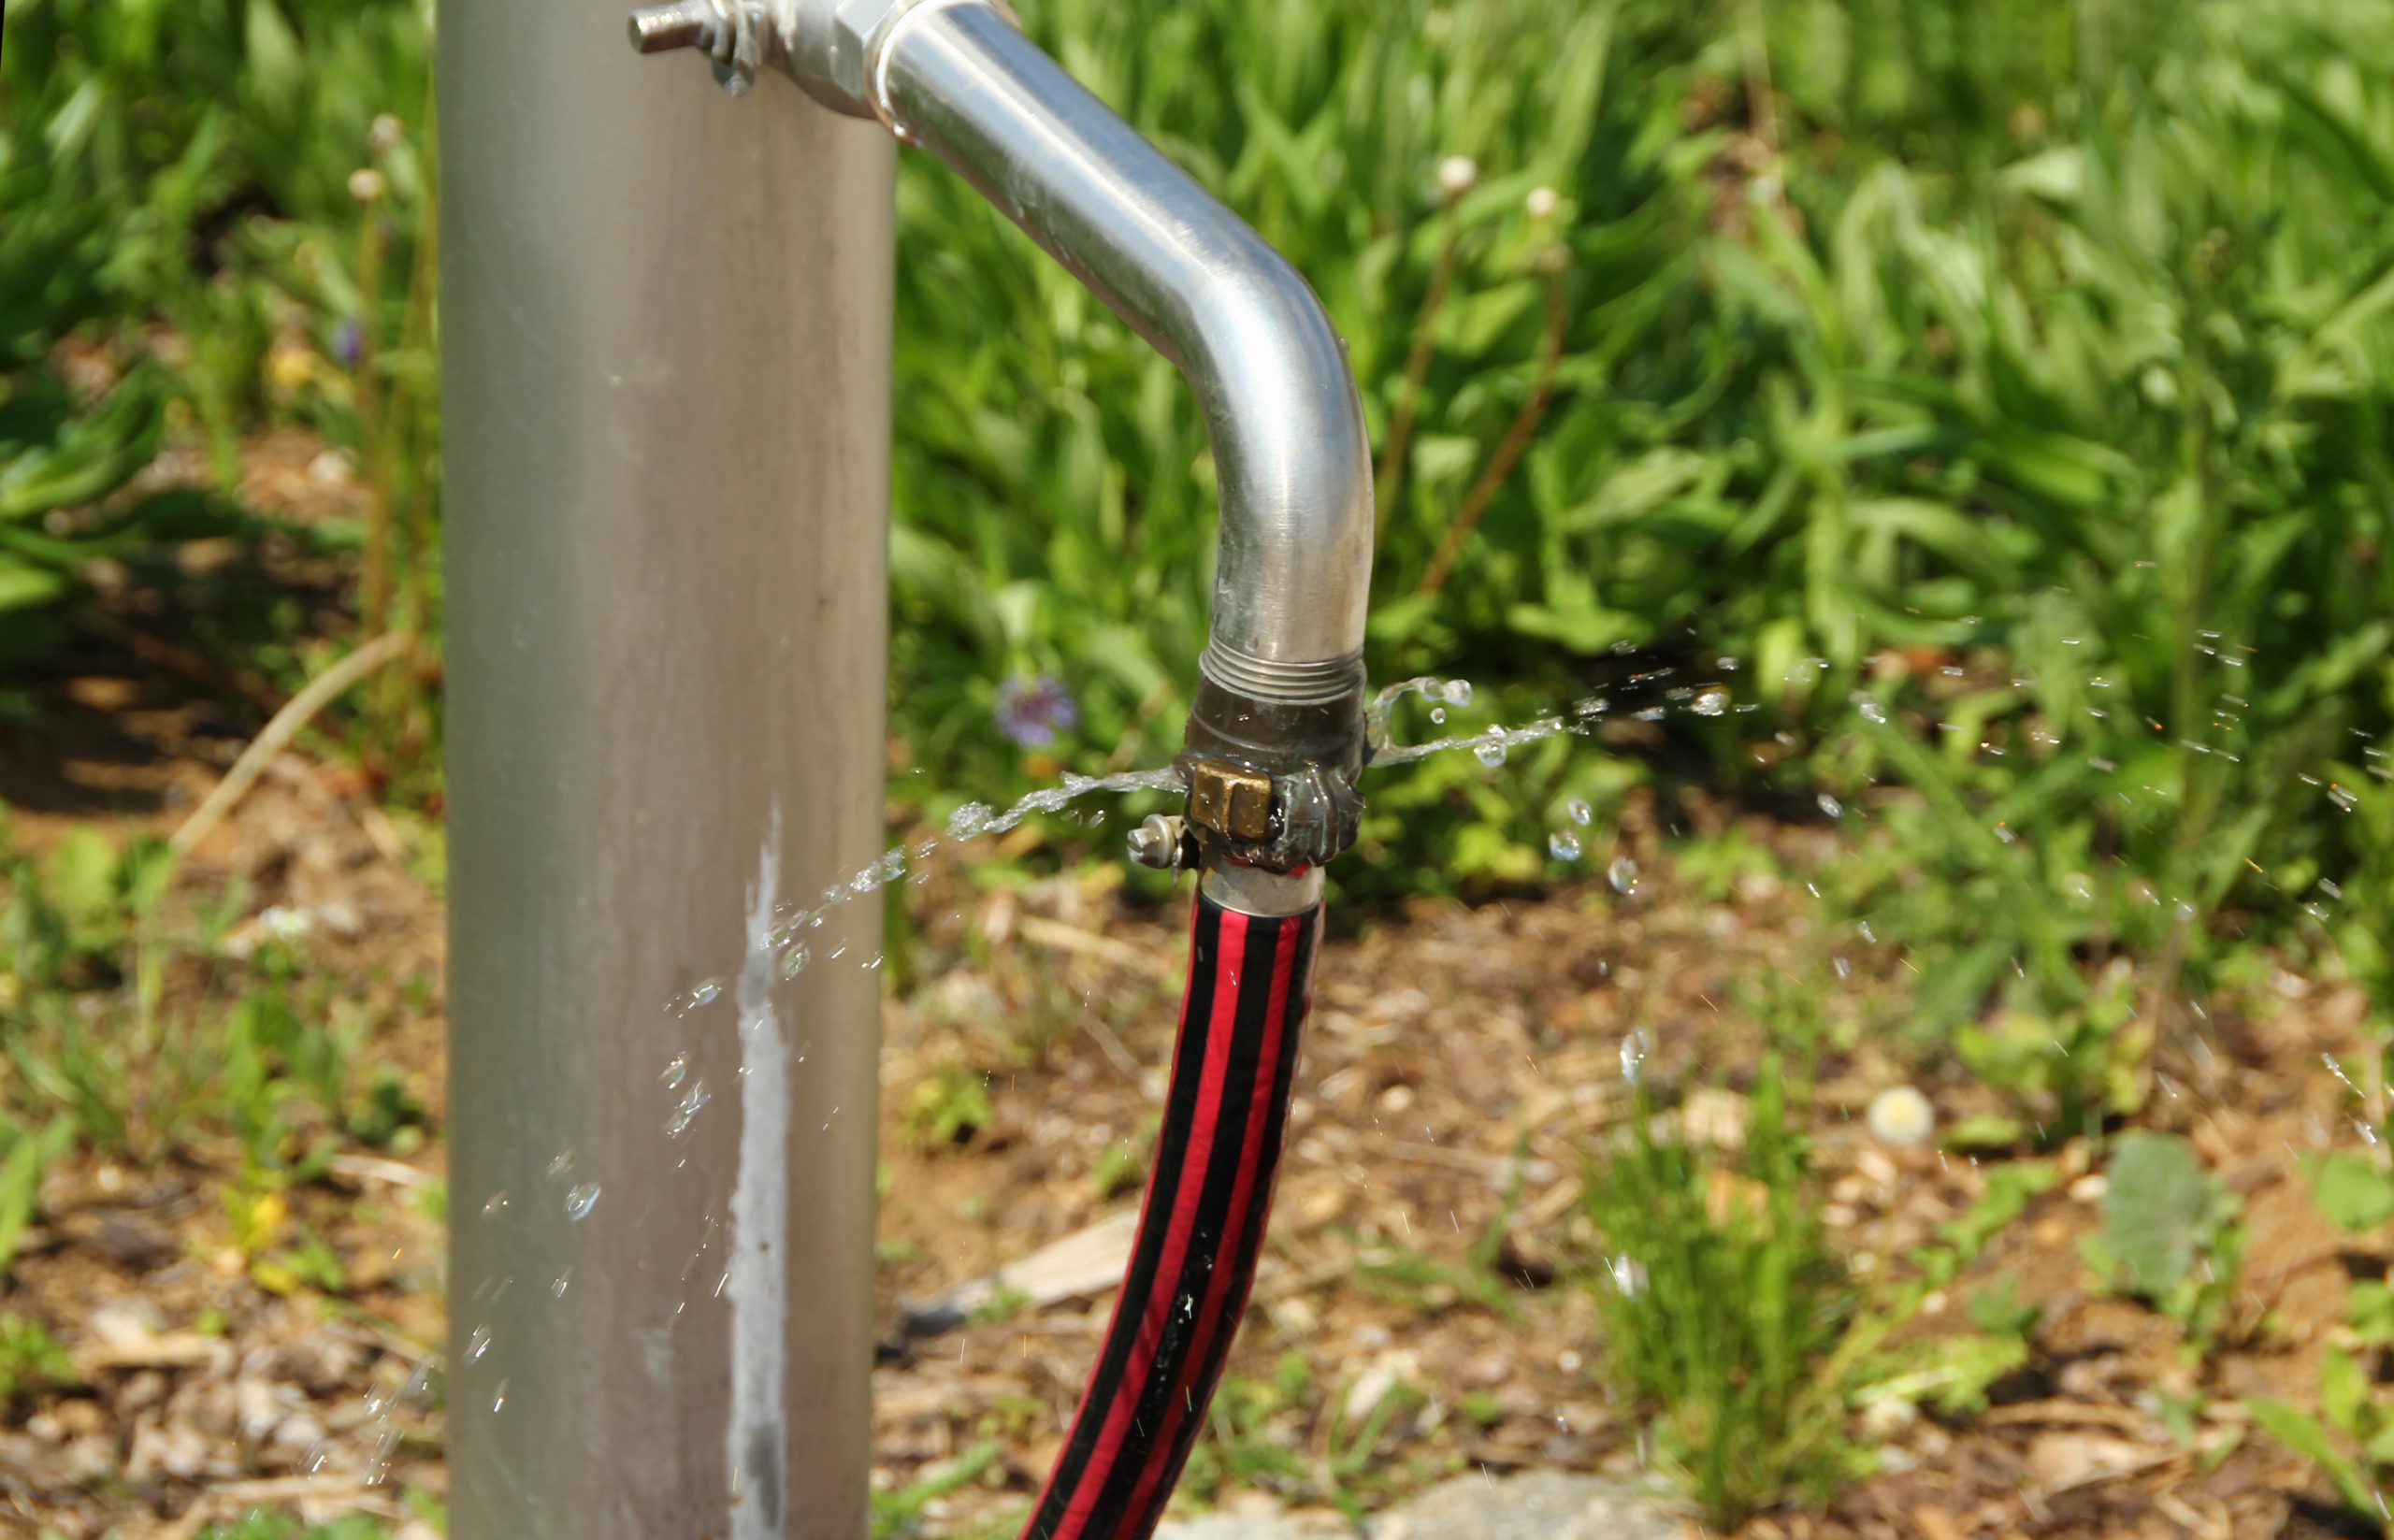
Figure 1: water leaking from hose fittings (Source: istock)
Leakage in fittings normally occurs where two different materials join. For example, a rubber O-ring in between two pieces of metal pipe held together by a clamp. The leakage from these fittings is small and maintaining and monitoring the fittings can identify when the leakage rate becomes too high and subsequently can be repaired.
O-rings (or seals) are typically used to minimize leakage between two very hard materials. For example, a connection of a valve to a metal pipe. The level of leakage depends on the material used for the O-ring, the gas to be contained, the pressure difference between the gas and the outside, and the physical dimensions of the connection. So, leakage can be managed by changing the pressure, or replacing the seal if it is worn.
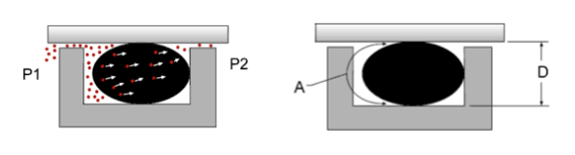
Figure 2: Permeation through an O-ring (Source: https://www.marcorubber.com/o-ring-permeation.htm)
Leakage also occurs from areas where movement is required, for example a valve. The movement of the two materials and the seal in between causes wear over time and subsequently will result in higher leakage.
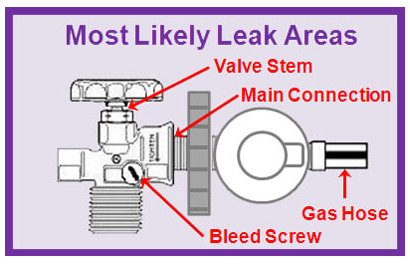
Figure 3: Illustration of most likely leak areas of a gas valve (Source Elgas: https://www.elgas.com.au/blog/505-bbq-gas-leak-test-gas-grill-barbecue/).
From a safety perspective, the soap test is commonly used to test for leakage. This involves applying a soapy water solution to the fitting after it has been connected and pressurised. Leaks can be seen through the formation of bubbles in the soapy water, and in that case, it is recommended to adjust the fitting.
Nano leaks from gas stoves
A research study by Eric Lebel measured methane emissions from natural gas cookers in residential homes. They measured these rates in 53 homes and then applied their results to the total 43.4 million gas cookers in the USA. Different combinations of cookers included hob burners, ovens or broilers. They collected methane samples when the cooker was not being used, when it was being switched on or off and when it was being used and compared this to a background methane measurement. They isolated the cooker from the remainder of the home by installing a plastic partition.
The key finding was that on average, the stoves emitted 58 mg of methane an hour when they were not in use, or 1.3 g per day. To put this into context, using a large burner for 30 minutes to prepare dinner would consume 117 g[1] of gas so this is a very small amount of leakage. They noted that 10 per cent of the gas stoves contributed 50 per cent of the emissions, so the average is skewed (upwards) by including this small number of stoves.
The maximum leakage rate in the Australian Standard for testing gas appliances is 1 mL/ min, which results in a leakage rate of around 40 mg/ hr – like the average in the US study.
The leakage level does not seem like a lot but over a year and including emissions from switching on and off, this equates to 649 g per stove. 76 per cent of these emissions occurred during periods when the cooker is off. It was assumed that the 53 stoves tested in California were representative of all stoves in the US. This is questionable. Nevertheless, the researchers multiplied the measured average by 43.4 million cookers in the US and claimed that the total emissions of methane from stoves in the US was 28,000 tonnes per year.
Contribution to global warming
Since natural gas is predominantly methane, any leaks from natural gas contribute to global warming. Methane is also a more potent greenhouse gas compared to carbon dioxide with the commonly accepted 100-year multiplier being 28[2]. Lebel – and many other anti-gas activists – prefer to use a different multiplier based on a 20-year horizon instead of the agreed 100-year horizon. The result is that Lebel multiplied the methane emissions by 86 instead of 28 to determine the potential climate impact. This results in 2.5 MT CO2-e from the leakage of methane from stoves in the US. Total US emissions in 2019 were 6,558 MT CO2-e, so the research is only referring to less than 0.04 per cent of these. Or when applying the correct factor, the emissions from methane leakage from stoves in the US represents around 0.01 per cent of the total US emissions. Definitely a nano-leak.
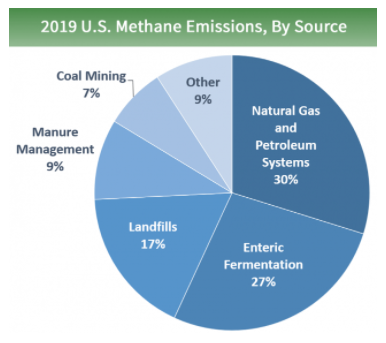
Figure 4: Breakdown of US methane emissions by industry sector (Source: www.epa.gov)
Total methane emissions in the US accounted for 10 per cent of its annual emissions. A range of actions[3] are being pursued to reduce these emissions such as upgrading equipment for transporting oil and gas or improving manure management practices in the agriculture sector.
The financial and practical implications of this should also be highlighted. The leakage results in 18.8 kg CO2-e being emitted per stove. At an Australian Carbon Credit Unit price of $56.50 per tonne of CO2-e[4], the cost impact of that leakage is $1.06. Replacing seals and O-ring to minimise – although this will not eliminate – the nanoleaks from stoves does not make sense.
Gas networks decarbonisation journey
Gas appliances should be regularly services to ensure that they continue to operate safely, and adequate ventilation should be used when using gas stoves. Industry is already completing work to upgrade the distribution networks[5] and as such reduce methane emissions.
Through Gas Vision 2050[6], Australia’s gas networks are on a decarbonisation journey to reach net-zero emissions by investing and demonstrating technologies such as hydrogen and biomethane. This will further reduce methane emissions.
[1] Assumes that the burner uses 9 MJ of gas per hour and that the net calcific value of gas is 38.3 MJ/ kg
[2] http://www.cleanenergyregulator.gov.au/NGER/About-the-National-Greenhouse-and-Energy-Reporting-scheme/global-warming-potentials
[3] https://www.epa.gov/ghgemissions/overview-greenhouse-gases
[4] https://accus.com.au/
[5] https://www.australiangasnetworks.com.au/our-business/about-us/gas-mains-renewal-program
[6] https://www.energynetworks.com.au/projects/gas-vision-2050/


