Solar’s pole volt – striking a balance
In May 2020, the UNSW Centre for Energy and Environmental Markets released a report[i] on the state of voltage in the distribution network and its relationship to the growing deployment of distributed photovoltaics (DPV). This work was requested by the Energy Security Board and based on information provided by Solar Analytics of about 7,000 sites.
The study found that in the acceptable range of voltages (between 216V and 253V), most networks in Australia generally sit on the higher end of the spectrum. While this may be a shock to pundits, it is a well-known fact that networks have been working hard to manage for some time. We explore some of the reasons why things are the way they are, what distribution network service providers (DNSPs) are doing to prepare their networks for the future and what we should take away from the study.
What does the report say?
The UNSW report is a hefty tome. More than 189 pages, it reiterates many key issues that most in the industry are already aware of, but it does make some findings worth noting, including:
- the lack of low voltage (LV) visibility;
- the voltages of the sample (~12,500 sites) tend toward the upper bounds (closer to 253V); and
- a correlation between solar export and high voltages.
| What is voltage?
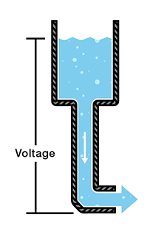
Voltage can be described as “the pressure that pushes charged electrons through a conductive material, like a copper wire”. A simple example that works well for general explanations is the water pipe example shown below.
Figure 1: Example voltage diagram (Source: Sparkfun) In this example: 1. Charged electrons are represented by the water 2. Voltage is the water pressure 3. Current is the water flow (amount of water passing through a point) Another characteristic is that voltage (like water pressure) drops the further you are along a circuit. Think of water travelling down a long hose that could be blasting away at the beginning but dribbling by the time it gets to the end. |
Unfortunately, many people have simplified the findings of the report down to “voltages on the distribution network are too high and must be lowered, which should fix everything”. This statement is far too simplistic to be taken seriously, as shown by the figure below.
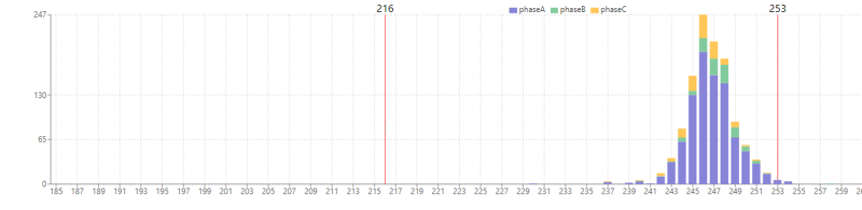
Figure 2: Minimum demand, Spring 2019, 7 pm from South Australian smart meter data (y-axis shows the aggregate number of consumers, the x-axis is voltage)
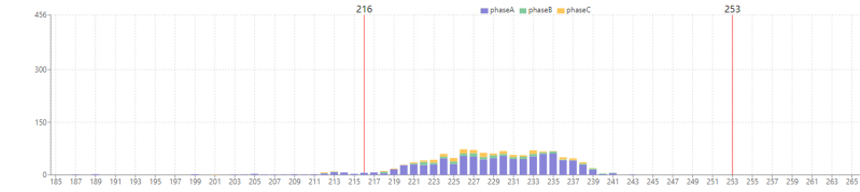
Figure 3: Peak demand, Summer 2020 from South Australian smart meter data, 7 pm
The two figures above are of the same, unaltered network, but less than three months apart. The difference is dramatic.
DNSPs could spend a fortune fixing every single occurrence of “high voltages” in their networks, which would solve one problem – …until summer when voltages are suddenly too low due to air conditioner demand.
Any solutions that DNSPs implement must be safe and cost-effective. They also must be in accordance with their obligations under the National Electricity Objective (safety, cost and reliability) and meet customer expectations. One challenge is many customer expectations regarding solar enablement simply aren’t in the rulebook (the National Electricity Rules), which determines what DNSPs can invest in. In the Open Energy Networks project[ii], we explored how these investments can also smear the cost of the solution across customers with and without solar, which is not equitable.
Are voltages too high?
If they’re above 253V then yes, but otherwise it depends.
For solar PV owners who live next to each other, don’t use much energy at home, don’t have home batteries and are keen to export everything they generate, then higher voltages are bad.
However, if you live further down the end of a feeder, don’t have solar panels and want to run your TV, oven, dishwasher and air conditioner on a hot day then higher voltages are in fact very good.
| Voltage reacts differently to demand and solar PV
At the distribution level and in cases where customers are only using energy, the laws of physics dictate that voltages will only drop in proportion to the demand. This has been the case for more than a century as households only consumed electricity and didn’t generate it. Fast forward to the 21st century where rooftop solar PV is common, many of these houses now generate electricity and export the energy they don’t use back into the grid. This increases voltages in the nearby network. When a whole street exports excess energy then voltages quickly creep up higher and higher until they are above 253V. |
Voltages on the higher end of the spectrum highlight the tension that DNSPs must manage across the needs of tens of millions of customers. Easy to say, hard to do.
What are networks doing about high voltages?
DNSPs are very aware of voltage issues and are developing and implementing a range of innovative solutions, including:
- ongoing upgrades to network equipment, specifically for dynamic voltage regulation;
- development of “solar sponge” tariffs in South Australia;
- increased investment in data analytics to drive state estimation in Queensland or unlocking insights from smart meter data in Victoria;
- working with industry to develop the standards and guidelines needed for future networks; and
- working with customers and market bodies to create more appropriate rules for the changing energy system.
The problems we are experiencing now are merely symptoms of larger issues that we need to address, such as the evolution of the rules and regulations. It is crucial that we don’t let the “growing pains” of the network transformation blind us to the long-term goal of a cost-effective, renewable and resilient system that supports all customers, whether they have solar or not.
[i] https://www.dropbox.com/s/8rdvthjsg9ntats/ESB%20Report%20Voltage_Master_040520_Final.pdf?dl=0
[ii] https://www.energynetworks.com.au/projects/open-energy-networks/


