Solar saturation: sooner than we thought
A substantial proportion of Australia’s zone substations will reach reverse demand/power flows significantly earlier than previously thought. The Open Energy Networks project uses updated data to map how soon zone substations reach a 40 per cent threshold penetration of rooftop solar adoption. Read more to see the maps.
Reverse Demand: the Grid under stress
The risk of reverse demand/power flows associated with high rooftop solar adoption has been a growing national issue, identified as a clear priority in the 2017 Electricity Network Transformation Roadmap (ENTR).
The expansion of solar and other distributed energy resources (DER) have changed our grid, a distribution system originally designed for unidirectional power flow but now required to accommodate two-way flows that can fluctuate significantly within relatively short time periods.
As seen in Figure 1, modelling undertaken by CSIRO for the ENTR in 2017 indicated that while South Australia was most at risk of reverse power flows, other states, or particular substations within a state (i.e. South East Queensland), were anticipated to face similar issues increasing over time.
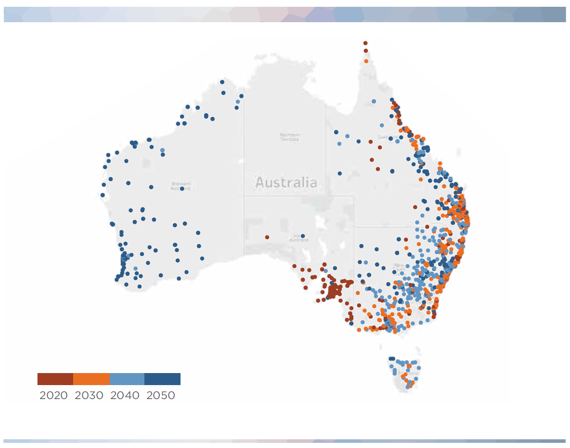
Figure 1. Projected decade in which each zone substation will reach a threshold penetration of rooftop solar adoption (40 per cent) indicative of reverse demand/power flow (From Electricity Network Transformation Roadmap 2017)
These findings were based on a review of the relationship between rooftop solar’s share of total annual load at the zone substation and reverse power flows as a general indicator of other power quality issues. It was found that some reverse power flows occurred at 30 per cent rooftop solar load but were common from around 40 per cent of load. CSIRO then examined when each substation would potentially meet that threshold, during the period to 2050, to determine when they reach this 40 per cent threshold.
Why is this an issue?
In managing traditional distribution networks with unidirectional flow, there was limited need for control of the feeder as it was typically set up so that the range of anticipated voltage excursions did not exceed the allowable voltage limits. However, with increased distributed energy resources penetration, this is no longer possible in many cases without dramatic excursions outside the allowed voltage limits (with subsequent rooftop solar inverter tripping), unless dynamic control is implemented.
Given the relatively low level of monitoring and control that was implemented to cope with what was a relatively predictable operating regime, significant enhancement of monitoring and control functionality is required to provide for the robust connection of distributed energy resources within the safe technical range of the network’s capacity, and to allow for optimising the performance of the integrated network with its connected devices.
Updated forecasts
Open Energy Networks, Energy Networks Australia’s joint project with the Australian Energy Market Operator (AEMO) is currently investigating how to transition the grid to a high distributed energy future. The map above has been re-done using updated data from the latest NEM and WEM 2018 Electricity Statement of Opportunities (ESOO) to identify when the zone substations will go into reverse demand/power flows. The results are outlined in Figures 2, 3 and 4.
The analysis has been run under all three ESOO scenarios (i.e. slow, neutral and fast DER uptake). It indicates that zone substations in some areas of Australia, such as Adelaide and south east Queensland have already met the threshold or will do so before 2025.
The speed of solar PV uptake will have a major impact on how quickly significant challenges emerge. Under the low uptake scenario, the remainder of the WEM and NEM will not have a significant share of substations over the threshold until around 2040, which was similar to the Roadmap analysis.
Under the slow uptake scenario we will see 15% of zone substations hit the 40% penetration mark by 2025, roughly one in every seven. But under the fast uptake scenario this figure rises to 23%, almost a quarter of all zone substations.
This is slightly more pronounced in the populated areas of the coast, but not exclusively so. Much of Queensland is red in the fast DER uptake scenario.
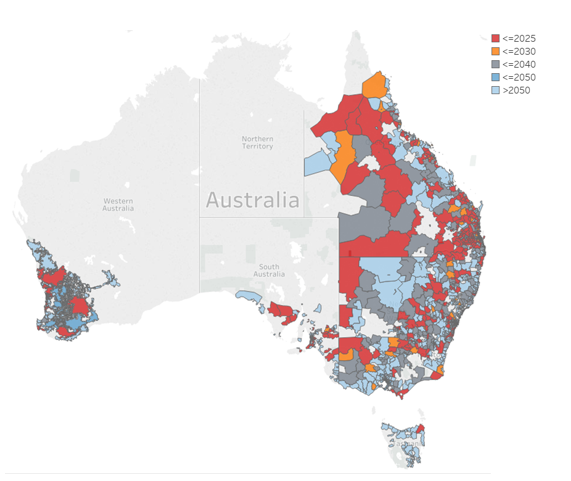
Figure 2. Updated projected decade in which the zone substations within each Australian postcode within the NEM and WEM will reach a threshold penetration of rooftop solar adoption (40 per cent) indicative of reverse demand/power under the ESOO Slow DER uptake scenario (From Open Energy Networks 2019)
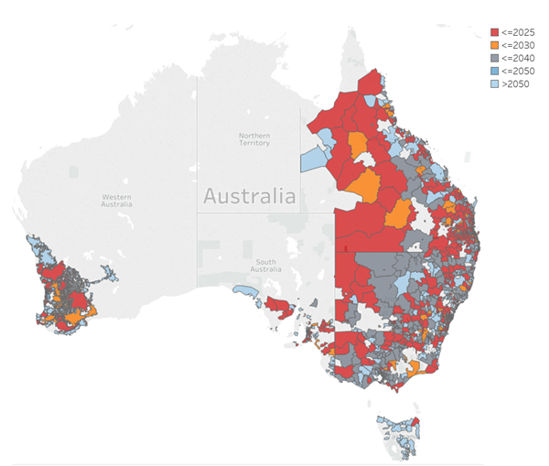
Figure 3. Updated projected decade in which the zone substations within each Australian postcode within the NEM and WEM will reach a threshold penetration of rooftop solar adoption (40 per cent) indicative of reverse demand/power under the ESOO Neutral DER uptake scenario (From Open Energy Networks 2019)
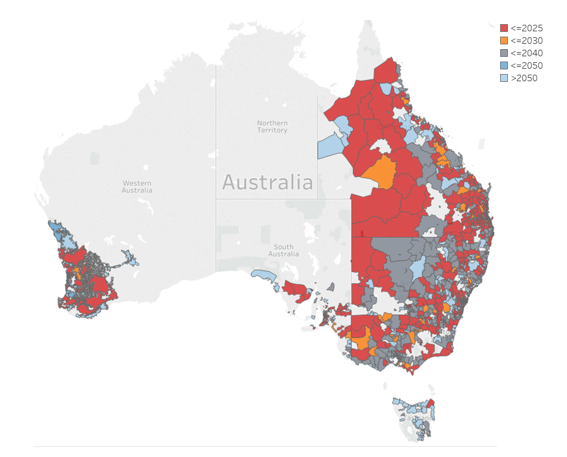
Figure 4. Updated projected decade in which the zone substations within each Australian postcode within the NEM and WEM will reach a threshold penetration of rooftop solar adoption (40 per cent) indicative of reverse demand/power under the ESOO Fast DER uptake scenario (From Open Energy Networks 2019)
What to do about this?
Given the updated outlook, the enhancement of monitoring and control functionality required to manage the system when it goes into reverse demand will be required earlier for some sections of the network than previously thought.
Through the Open Energy Networks project, Energy Networks Australia is taking a lead role in this adaption by redesigning the management of distributed energy resources (solar and storage devices, including electric vehicles) in partnership with AEMO.
The best way to manage voltage issues and integrate increasing levels of solar and storage into the system is to develop a smarter and more flexible grid. Electricity networks are working towards being coordinated and optimised both locally and across the wider energy system – Open Energy Networks is examining how best to do this.
