Countdown – Network Data Top Ten
Energy Networks Australia (ENA) and ENEA Consulting Australia recently released a report ‘Data opportunities for smarter networks’ to understand where our electricity transmission and distribution companies were heading on their data journeys.
What we discovered was that while each network was slightly different and faced different issues, most identified common targets in the future which they were all working towards.
The purpose of the report was to achieve three objectives:
- Identify current/medium term data uses.
- Identify gap and challenges to implement these use cases.
- Make recommendations to NSPs and industry participants to enhance data-driven networks.
During this project we not only interviewed all Australia’s electricity transmission and distribution company members, but also a range of metering companies, technology vendors and other data providers. In total we undertook 28 interviews, with 44 stakeholders from 22 organisations with people across a variety of roles, see Figure 1.
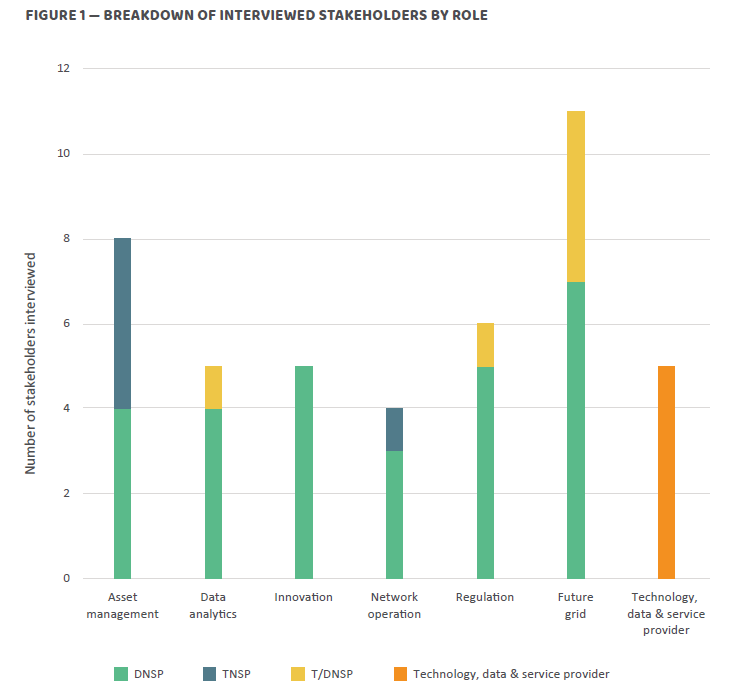
Figure 1: Breakdown of interviewed stakeholders by role Source: ENA ‘Data opportunities for smarter networks’ report.
As shown, a total of 22 use cases were identified from the interviews, but it was clear from the start that there were some commonalities emerging specifically in thelow voltage (LV) network and tied to the growing uptake of DER. ENEA has further explored each use case in the top 10 of Figure 2 in greater detail in the appendix of the report.
You’ll also notice that almost all use cases are spread across at least two regulatory price periods, this is important to note for reasons we’ll cover next.
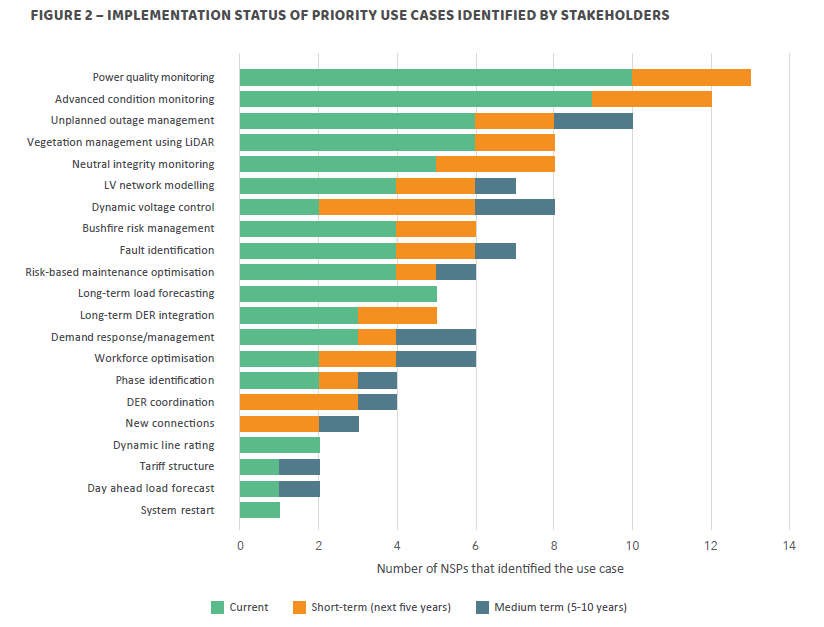
Figure 2: Implementation status of priority use cases identified by stakeholders (Source: ENA ‘Data opportunities for smarter networks’ report.)
Interestingly, many of the use cases here either directly or indirectly contribute to the required capabilities of the Open Energy Networks (OpEN) Interim Report which looked at the future of DER integration.
Why are the use cases different between networks?
In Australia there are 18 different electricity transmission and distribution network service providers (NSPs) operating different network topologies, across a range of environments and jurisdictions. Some of the differences include
- Smart meter deployment – differences between the states related to the approach to Power of Choice have led to hugely disparate uptake due to state incentives and customer preferences.
- Level of DER penetration – some states have significant government incentives driving uptake that affects the nature of the issues NSPs are resolving.
- Rural and urban – networks are planned, designed and managed depending on the local environment and the needs of customers it serves, think leafy green suburbs and hot, dry deserts.
- Size of NSPs – Not all NSPs are large and able to spread high capital costs across many customers to minimise the cost per customer.
- Transmission and distribution – both experience different perspectives in different parts of the value chain.
While it’s common in the media to portray networks as homogenous monoliths, it’s critical to recognise the diversity of each NSP and the customers they serve. Many customers want things like renewable energy, but solutions look different depending on where you are i.e. solar PV in South Australia or microgrids in the Northern Territory.
No matter what people say there are no silver bullet solutions, but rather “horses for courses”.
Challenges identified
The path to digitalisation is never easy, but the first step is knowing what obstacles there are to overcome. ENEA has identified five types of challenges that network digitalisation faces:
- Data quality and integration – not all data is created equal, there are no standards for 3rd party provided data to networks and making decisions on data of inconsistent quality and integrating with existing systems can be challenging.
- LV network visibility – many states do not have the advantage of ubiquitous smart meter deployment and the value of what might be available is highly subjective in the competitive market.
- Culture and organisational change – some NSPs found it difficult to attract talent and then appropriately place these resources within their businesses e.g. should data analysts be in IT or in network planning.
- Cybersecurity – Increasing threats are building momentum for networks to respond, but there needs to be stronger collaboration between government and industry to make sure that what is mandated is proportionate to the threats
- Justifying IT expenditure – large, fixed capital costs make increasing digitalisation a challenge for NSPs serving a smaller number of customers and more work needs to be done developing guidelines for ICT expenditure
It will take continued collaboration between industry stakeholders to find the best answers, not just the simplest ones.
The key takeaways
Networks are continuing to digitise their networks through a range of no-regrets actions that makes sense economically. This doesn’t mean progress is slow, in fact the opposite is true in many parts of Australia, but we do need to recognise that the pace of change is different.
Some thoughts on where to from here
- Let’s reassess what data is available and what might provide the best mix of cost and benefits to society if networks had better information.
- Cybersecurity is critical, but let’s make sure we are working together to develop what ‘best practice’ actually means and how we invest in ICT in a way that makes sense to everyone.
- Starting in different places on the data journey doesn’t mean we’re all in it alone and ongoing knowledge sharing is the key to getting the best outcomes.
This is just the start of a long journey, but if we can get data off on the right foot then we can all reap the enormous opportunities along the way.


