Stacking up – how do we compare?
Electricity networks in the National Electricity Market (NEM) are continuing to deliver more for less as the Australian Energy Regulator (AER) 2021 Benchmarking reports for Distribution and Transmission released this week demonstrate.
The reports detail each network business’ productivity using a number of inputs and outputs, including the amount of assets, operating expenditure (opex), reliability, number of customers, maximum demand, total energy delivered and how far electricity is transported. They include information up to 2020 for Victorian distribution networks, and 2019-20 for non-Victorian distribution and transmission networks, referred collectively to as 2020.
An increase in productivity is defined as a higher ratio of outputs vs inputs than previously, and from a customer perspective means either lower bills, improved services, or both. Productivity is an important metric for regulators that is used during revenue determinations to ensure that network businesses’ revenues reflect the efficient cost of service provision.
Delivering more for less
Overall, distribution and transmission network productivity increased by 1.2 per cent and 1.7 per cent in 2020 respectively, continuing the trend of steady improvements made since 2015 and 2016. Notably for both distribution and transmission networks, overall inputs reduced, and overall outputs increased in 2020 compared with 2019.
Interestingly this is contrasted with a trending decline in productivity across the wider utility sector since 2017, where productivity has fallen by eight per cent. Economy-wide productivity also fell marginally over 2019 and 2020 presumably due to the pandemic. Electricity network companies seem to have navigated the period well in relative terms and have managed to avoid similar reductions.
Productivity of networks, economy and utilities, indexed
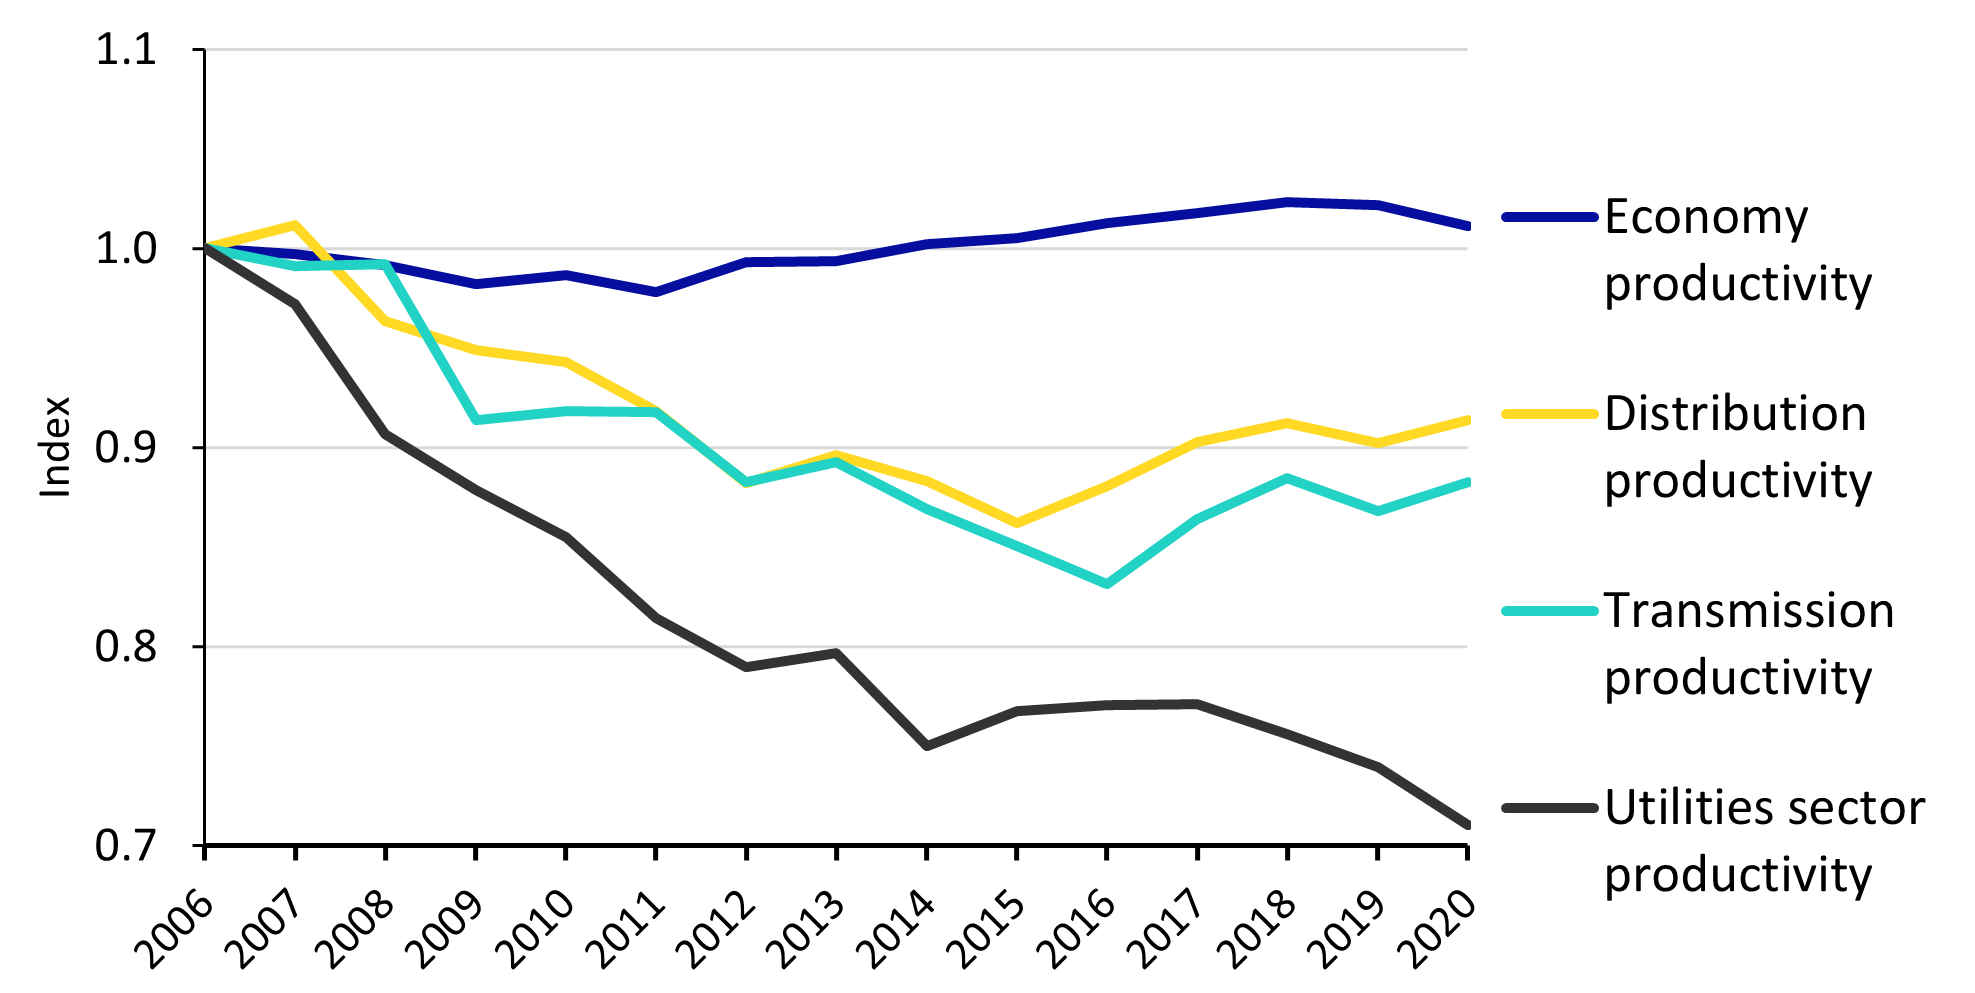
The long-term productivity trend for all distribution networks appears to be converging, meaning the gap between higher and lower performers is narrowing. The shorter-term trend across distribution and transmission networks is that networks with lower productivities are improving, pushing closer towards ‘middle of the road’ performers.
Opex savings and reliability improvements leading outcomes.
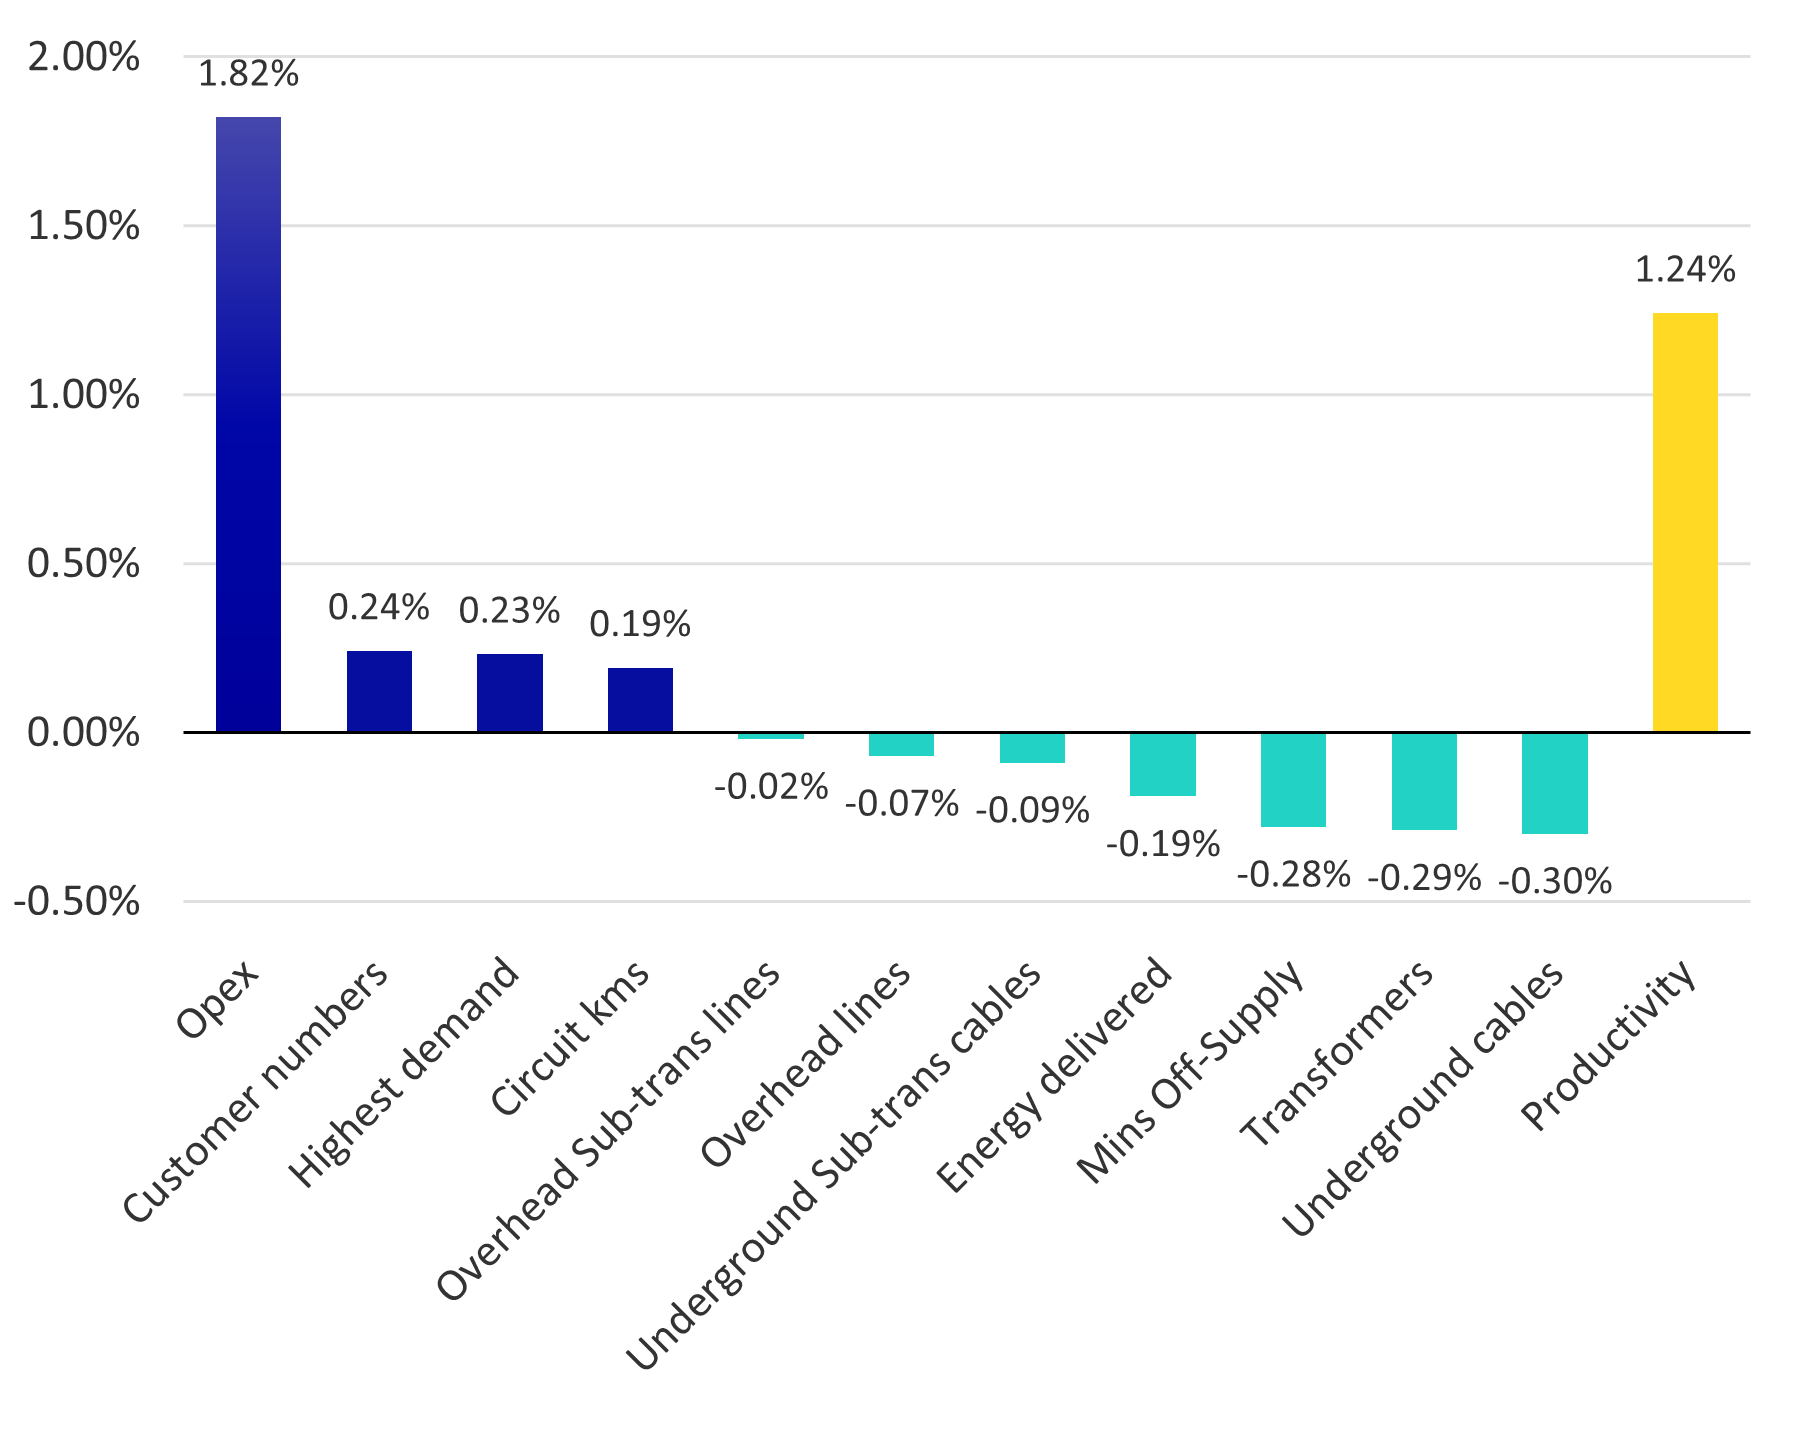
Most distribution productivity increases in 2020 resulted from reductions in opex, contributing positively to productivity by 1.8 per cent. Opex savings have been the predominant driver of distribution productivity improvements since 2015, with 3.1 per cent contributions to productivity per year. Opex productivity has been increasing by 3.1 per cent each year, which all else being equal will lead to lower revenue allowances in the future.
Distribution partial productivity measures, 2020 vs 2019
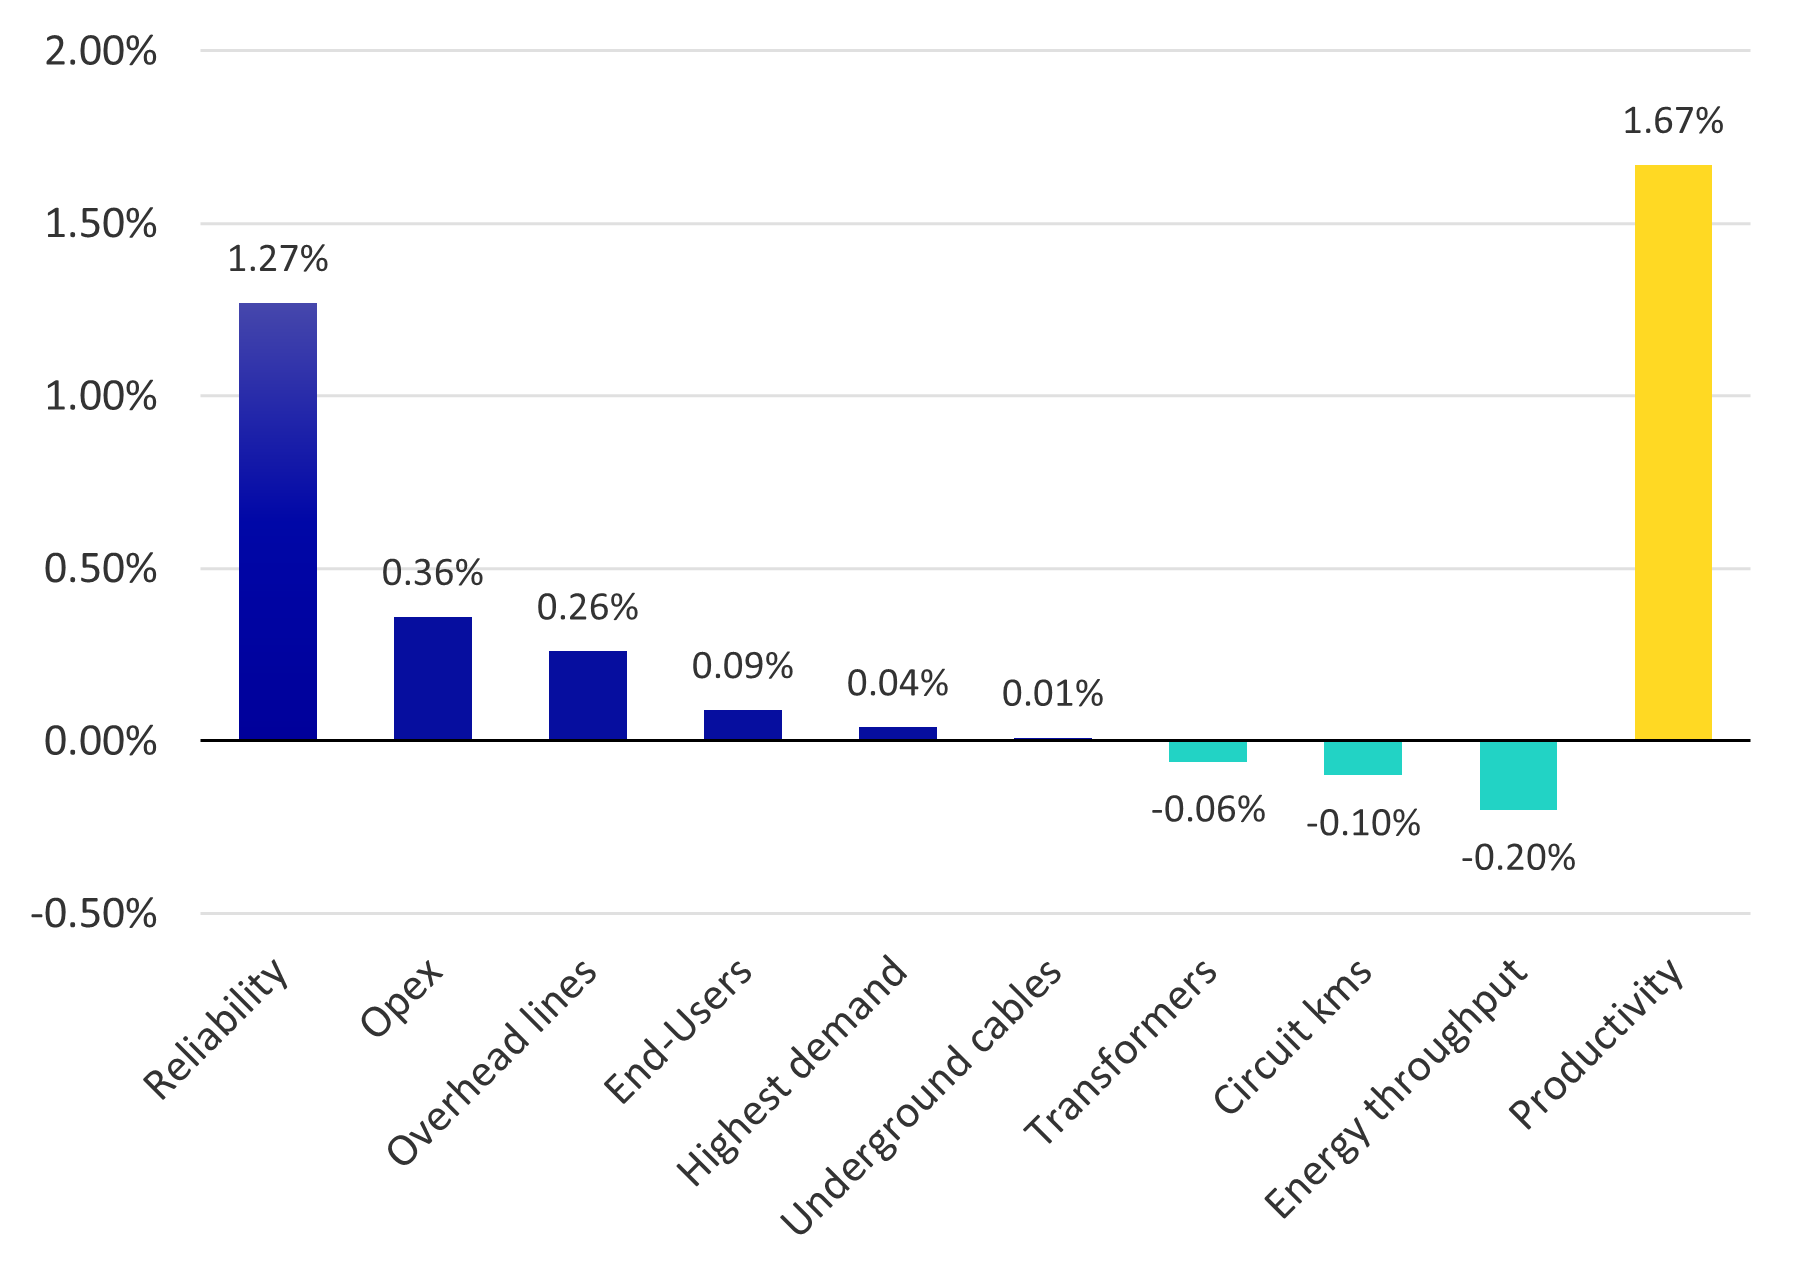
Transmission productivity improvements were led by higher reliability, recognised formally as lower unsupplied energy to customers. Smaller positive contributions to productivity were made by lower opex, fewer overhead lines and more customers.
Transmission partial productivity measures, 2020 vs 2019
Getting benchmarking right for customers
Benchmarking can be one of multiple tools for regulators and customers to understand how network businesses have been performing, but like most measures, the results are only as useful as the appropriateness of the inputs and analysis.
Like any analytical methodology, it’s prudent to revisit its appropriateness from time to time. For example, the benefits to consumers of enabling more distributed energy resources to be exported into the network aren’t currently recognised in benchmarking.
There are also some differences in how networks treat their opex and capital expenditure, which has led the AER to release a separate consultation paper on the issue. Benchmarking also factors in some operating environment condition differences between network businesses, but doesn’t materially account for differences in regulatory requirements, climate and geography.
There are also issues with some econometric models that compare the relative efficiency of network businesses. These models assume that an increase in output can only be achieved with an increase in inputs, but when network businesses deliver more by using less, some of the models break. Clearly these issues should be addressed.
The AER has an ongoing benchmarking development program looking at incremental improvements in data and methods, as well as focusing on specific issues such as those outlined above that could improve the reliability and applicability of benchmarking results. Improvements to the benchmarking program are highly sought after by industry.
More to be done
Productivity improvements delivered by network businesses are good news for customers, leading to improved service delivery or lower revenue allowances.
Ensuring that benchmarking appropriately recognises the types of services customers value is in customers’ interest as benchmarking results are considered during revenue determinations. Addressing some of the underlying inconsistencies between benchmarking methodology and delivering network services in practice will be key during the AER’s benchmarking development program.


