Networks delivering for customers
The AER’s 2021 Electricity Network Performance Report is an annual snapshot of recent electricity network performance that provides an historical overview of expenses and reliability. It also discusses various specific areas in more detail, including seasonal reliability, COVID impacts and regulated returns.
Regulatory year 2020 (referred to as 2020) is the most recent year’s data and its defined time period varies by network. 2020 means Victoria’s AusNet Transmission from May 2019 – April 2020, other Victorian networks over calendar year 2020, and all other networks over financial year 2019-20. Western Australian networks are not covered by the Australian Energy Regulator (AER).
Networks continue to deliver more for less
Customers spent less in real terms on electricity network services in 2020 than they have at any time since 2011, continuing the trend of declining network revenue.
Future electricity network revenue is forecast to continue declining in 2021, 2022 and 2023. Combined with expected low inflation for the foreseeable future, sustained downward pressure is likely to be put on network charges for some time to come.
Figure 1 – Trends in forecast building block revenue components – All electricity networks
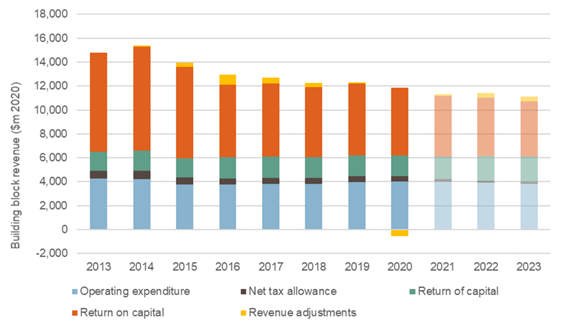
Source: AER, Electricity network performance report (2021), p. 11.
The lights went out fewer times in 2020 than in any of the previous 14 years while the duration of outages in 2020 remained similar to 2019, leading to an overall reliability improvement for customers.
Severe weather events are to an extent excluded from the reliability targets and performance measures for electricity networks as they can drastically impact reliability in any season. The AER is planning to undertake further work looking at severe weather event-related outages to see whether any learnings can be inferred.
Incentive-based regulation continues to drive strong performance for customers
Incentive payments to network businesses were positive in 2020, largely driven by reliability improvement payments under the Service Target Performance Incentive Scheme that contributed about two-thirds of overall payments.
Operating expenses and incentive payments under the Efficiency Benefit Sharing Scheme were low relative to historical levels, potentially indicating that ‘low-hanging fruit’ operating expenditure efficiencies are being exhausted.
2020 also saw the first payments under the Capital Expenditure Sharing Scheme as the first determinations to have the scheme applied to them ended in regulatory year 2019.
A properly operating incentive framework should drive efficient network improvements and deliver beneficial long-term price reductions and service enhancements for customers. Outperformance of incentive benchmarks demonstrates that incentive regulation is working in the interests of customers.
ENA-published analysis shows incentive-based regulation continues to drive strong reliability and business efficiencies which are benefiting customers by more than $6 billion.
Figure 2 – Estimated benefits to customers from the EBSS and STPIS 2006-2018
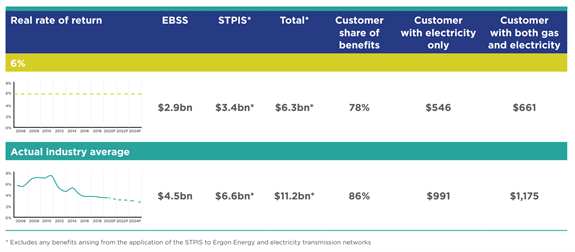
Source: ENA, Rewarding Performance (2019), p. 11.
Average network profitability continues to decline
The 2021 report features a dedicated discussion on some new and expanded network profitability measures. The report shows that network profitability is higher than forecast but continuing to decline on average, with the metrics showing a sustained declining trend since 2014. Network profitability is likely to decline further as lower rates of return increasingly take effect.
The AER’s 2018 Rate of Return Instrument locked in historically low rates of return that will apply to various networks across the industry from July 2019 to June 2027. Only 11 per cent of the impact of historically low locked-in rates of return in 2018 are reflected in the network performance report measures over the reporting period[i]. Last year, an AER-commissioned report concluded across a number of metrics that Australian regulatory equity allowances are below that of comparable international regulatory frameworks – raising questions about these settings going forwards.
While the reported measures can have relevance in considering the performance of the framework as a whole, they are ‘rear-view’ measures that don’t tell us a lot about what might be around the corner. As the AER observes, the value of the measures is in providing context to trends over time of the performance of the entire framework – rather than any single part of it.
So, while historical data is useful, a forward-looking view is going to be increasingly important to identify critical emerging issues and recognise the challenges networks face to support the transformation of the energy system.
[i] Calculated on a RAB-weighted average across time, taking into account what Rate of Return Instrument will apply to each network in each month and assuming constant RAB growth.

