Coal, renewables and the connective tissue
The World is seeing a “renaissance” of network investment, according to PWC.
There’s a lot of talk about how much renewable generation to inject and how rapidly to retire coal-fired power, but all this impacts the network.
It’s hasn’t been trendy for climate activists and some politicians to talk about building powerlines.
The reality is that current renewable energy sources, such as solar and wind, will only be viable if we have the transmission infrastructure to get that power to customers efficiently.
The “connective tissues”, as PWC calls it, of the network infrastructure will enable a sustainable energy future.
Recently, the Commonwealth Government has made several positive announcements about underwriting transmission projects. These announcements will help speed up key transmission investment to allow more renewable energy into the market.
The Future of Energy Report by PWC takes a look at global changes in the energy mix and how different scenarios may impact Australia.
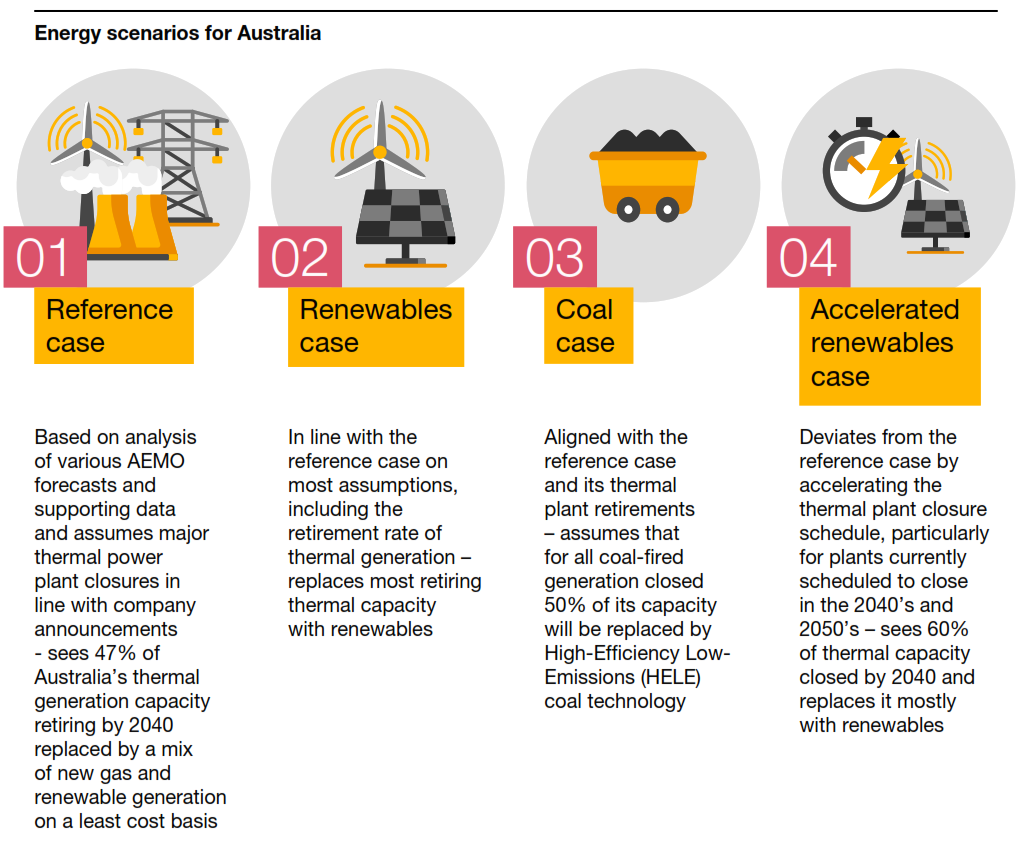
Figure 1: Summary of energy scenarios (Source: PWC report)
What does the report look at?
The report looks at three different scenarios and compares them to a reference and predicts how they may impact the future market in 2040.
The cases are outlined in Figure 1 and essentially show two different rates of renewable increases and one instance of replacing 50 per cent coal-fired generation closures with high-efficiency low-emissions (HELE) coal technology, compared with the reference.
As well as analysing different scenarios of the energy transition for Australia, the report also compares the shift in the global energy mix, increases in renewable generation, the impact of customer demand and the need for transmission.
Who’s starting to use more of what?
The global energy mix is shifting.
PWC collates some interesting comparisons of global trends in energy types.
In 2018, about $US300 billion was invested in renewable power generation, more than 2.4 times that of fossil-fuelled generation.[i]
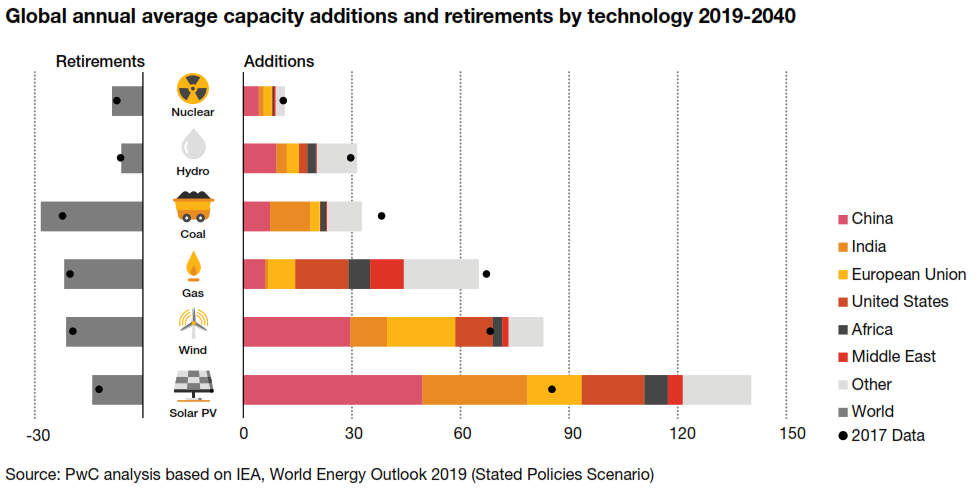
Figure 2: Global annual average capacity additions and retirements by technology 2019-2040 (Source: PWC report)
The replacement of coal generation is only just greater than retirement, with many countries moving away from it as a fuel source (see Figures 2 and 3).
The charts also highlight strong support for gas as a favoured fuel to replace coal, a trend that the Commonwealth Government has also backed in recent months.
Combined with the introduction of sustainable hydrogen, gas will be an important transitional energy source.
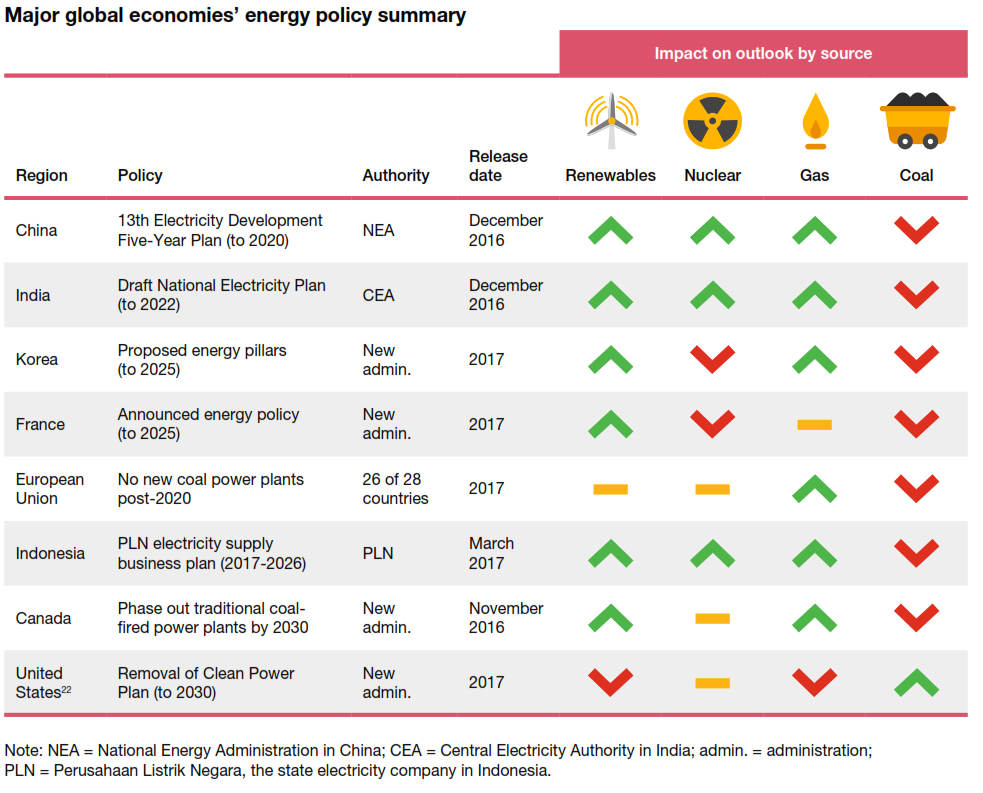
Figure 3: Major global economies’ energy policy summary (Source: PWC report)
Transmission
According to PWC, over the past four years, 7,400 MW of new capacity has been added to the National Electricity Market with only 190 MW of transmission investment to match it.[ii] Considering the bulk of renewable investments are not located at existing generation sites, we already see transmission choke points.
Around the globe, close to $US300 billion a year was spent on network assets in 2017 and 2018.[iii] This figure shows a growing trend for countries to increase interconnection and support a free flow of electricity.
In PWC’s modelling for their predictions for the different Australian scenarios, it assumes all “nation-building energy infrastructure projects” are included. This infrastructure includes Snowy 2.0 and Marinus Link.
Customer control
Customers will need more control over their energy use, particularly as we move to a more distributed energy resource future (more household solar and battery storage).
We’ve written before about how networks are innovating to deliver this control, and a greater voice, to customers.
Greater customer control is a part of delivering a sustainable energy future.
PWC talks about more a demanding customer with the energy sector under pressure to provide this greater control while reducing costs.
The report talks about the ‘local-power’ phenomena, which for networks presents both an opportunity and a significant challenge.
This change is driving new developments, but the report warns that “rigid investment regulations are restricting this development”.
Previously, we talked about changing the behaviour of customers when it comes to how batteries can help smooth demand and increase the stability of the grid.
The Results
The different scenarios modelled in the report yielded an only minimal difference in overall capital cost.
All scenarios showed a positive economic impact compared with the reference case.
PWC reported the most significant jump in GDP as a result of the renewables cases, though only a marginal difference between the two.
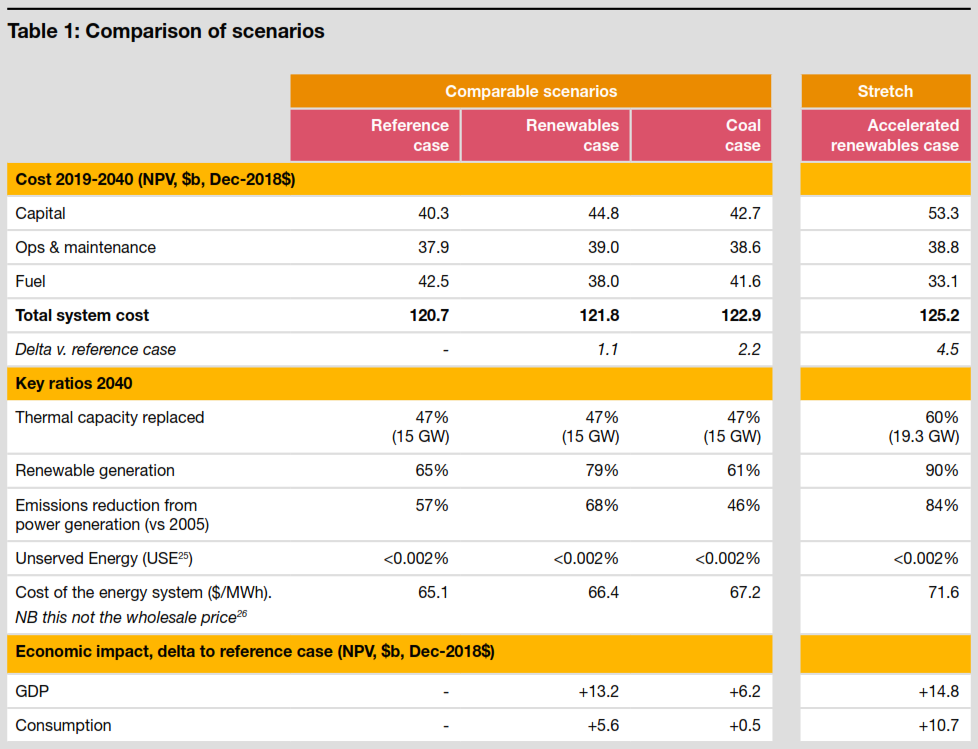
Figure 4: Comparison of scenarios (Source: PWC report)
What does this all mean?
The key will be planning for where we want to be.
Regardless of which scenario, the network is changing dramatically.
It is clear gas and additional transmission will have a major role to play in providing a flexible and strong energy system.
References

")
