Diving into the State of the Market
The Australian Energy Regulator’s (AER) State of the Energy Market 2021 has landed in our web browsers, with the report discussing almost everything energy related. This year’s behemoth contains plenty of interesting insights scattered throughout several hundred pages and today we’re diving into the network section, looking at the fun facts, simmering issues and noticeable trends.
Assets on the up, despite lower investment
The regulatory asset base (RAB) in simple terms is the sum of past investments a service provider has made in its network to deliver customers services. This year saw the combined electricity transmission and distribution RAB in National Energy Market (NEM) jurisdictions surpass the $100 billion mark, while the total is $112.5 billion when gas networks are included.
Total electricity network capital expenditure came in at under $5 billion in 2020, continuing a trend of lower network expenditure. From 2016 to 2020, $24.1 billion was invested in electricity networks, down 35 per cent from $37.1 billion over the preceding five years.
Network investment will need to increase at some stage as network assets continue to get older. The report shows that 25 per cent of distribution poles are more than 53 years old, with a sizable clump of poles installed during the 1960s. Poles this old often start to fail, leading to reliability issues. The median distribution pole is actually close in age to the average Australian’s age – around 37 years or so.
Overhead support structures – electricity distribution poles in the National Electricity Market
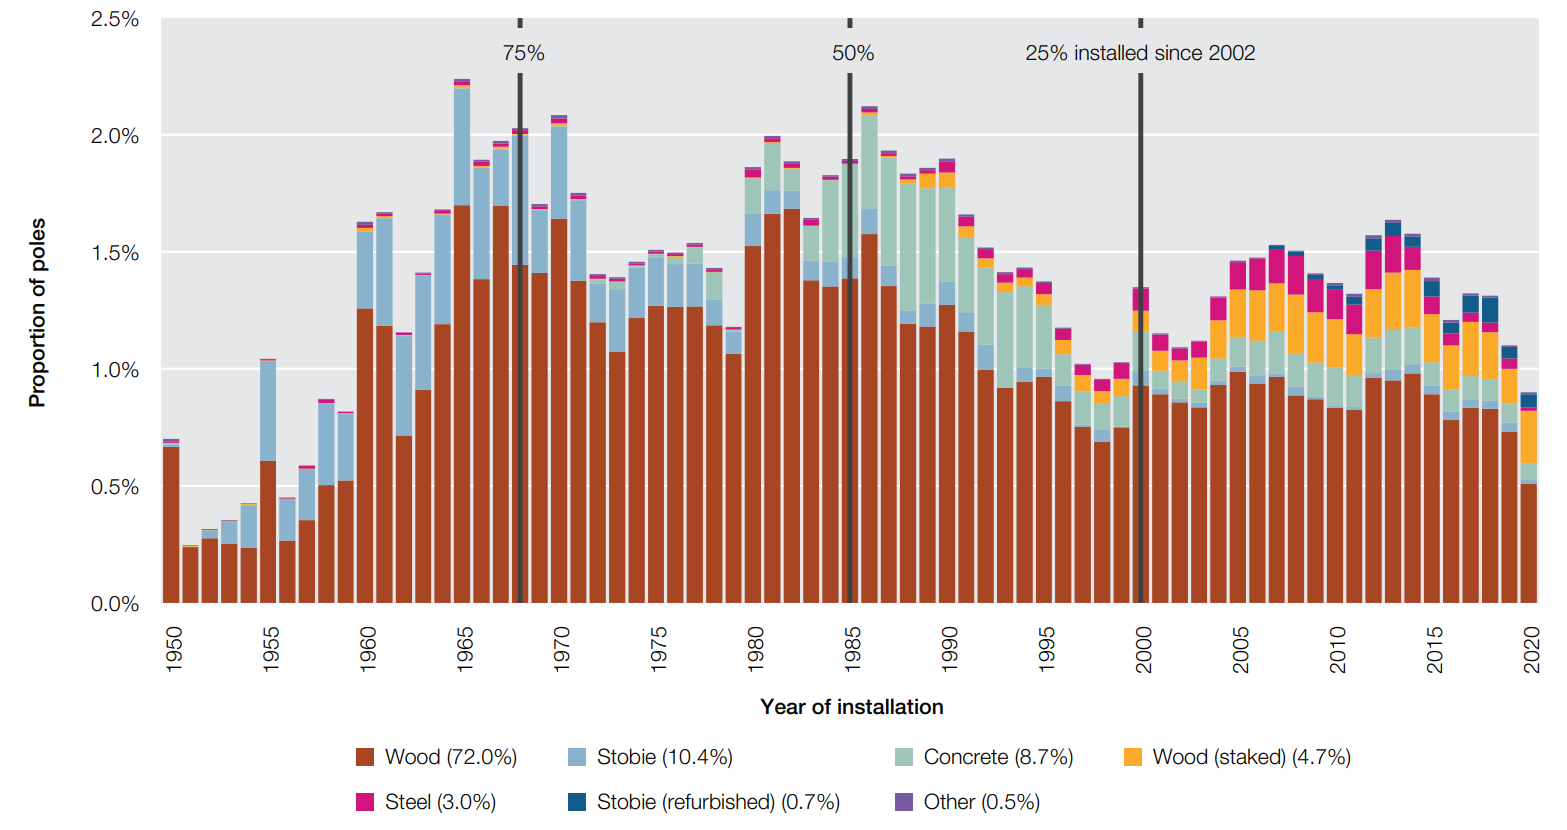
Source: Category analysis regulatory information notice responses
2020 saw the lowest number of distribution poles installed in electricity distribution networks since 1959, compounding an already simmering issue. Not paying close attention to aging assets could lead to a slippery slope against the ’bathtub curve’ of asset replacement needs. Also noteworthy is that 75 per cent of transmission towers currently in operation were built before 1989, with comparatively very few built subsequently.
Still, networks continue to do more with less as utilisation rates – the measure of overall usage of the network – continue to rise from their historic lows in 2015. This feat is impressive because more distributed energy resources (DER) and reverse power flows are placing downward pressure on utilisation rates.
Reliability improvements
Distribution network reliability is measured by total minutes off supply per customer and the number of supply interruptions per customer. 2020 saw a minor increase in minutes off supply but a four per cent reduction to 1.08 supply interruptions per customer, marking the lowest number on record and continuing a downward trend.
Interruptions to supply per customer – electricity distribution networks
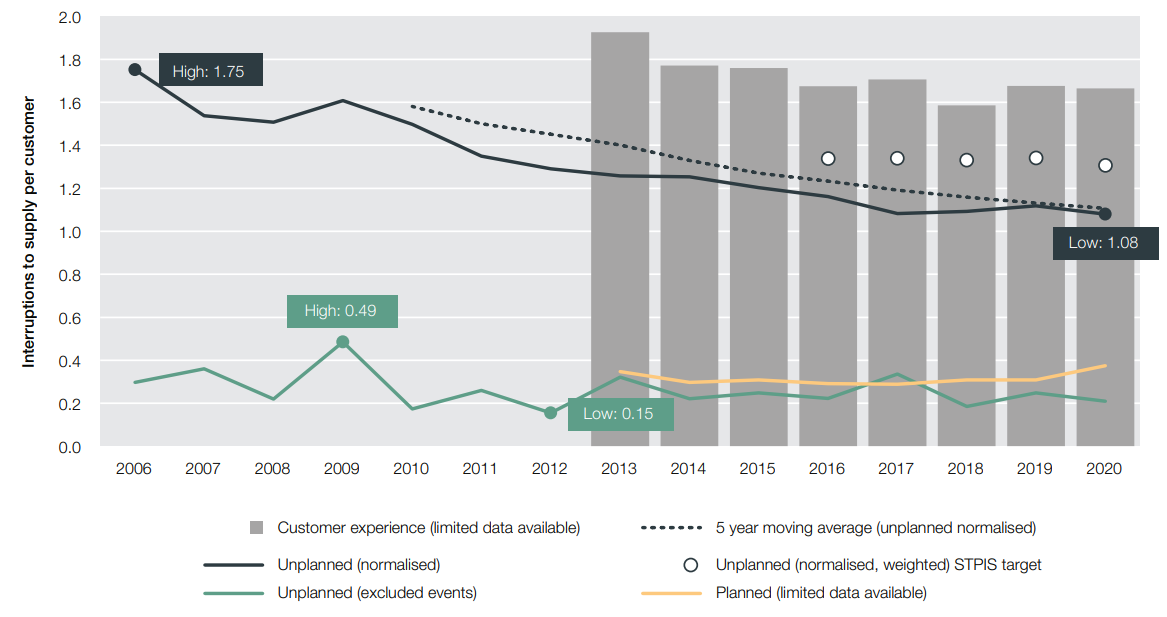
Source: AER modelling; economic benchmarking regulatory information notice responses
Distribution reliability measures are generally well known, but transmission reliability is less mainstream. Transmission reliability is measured by loss of supply events – defined as the number of times energy was not available to transmission network customers for between three seconds and one minute, varying by business.
Transmission customer loss of supply events were their second lowest ever, with just 10 recorded in 2019 after eight in 2018[i]. Loss of supply events have been steadily trending downwards since 2013.
Network reliability loss of supply events – electricity transmission
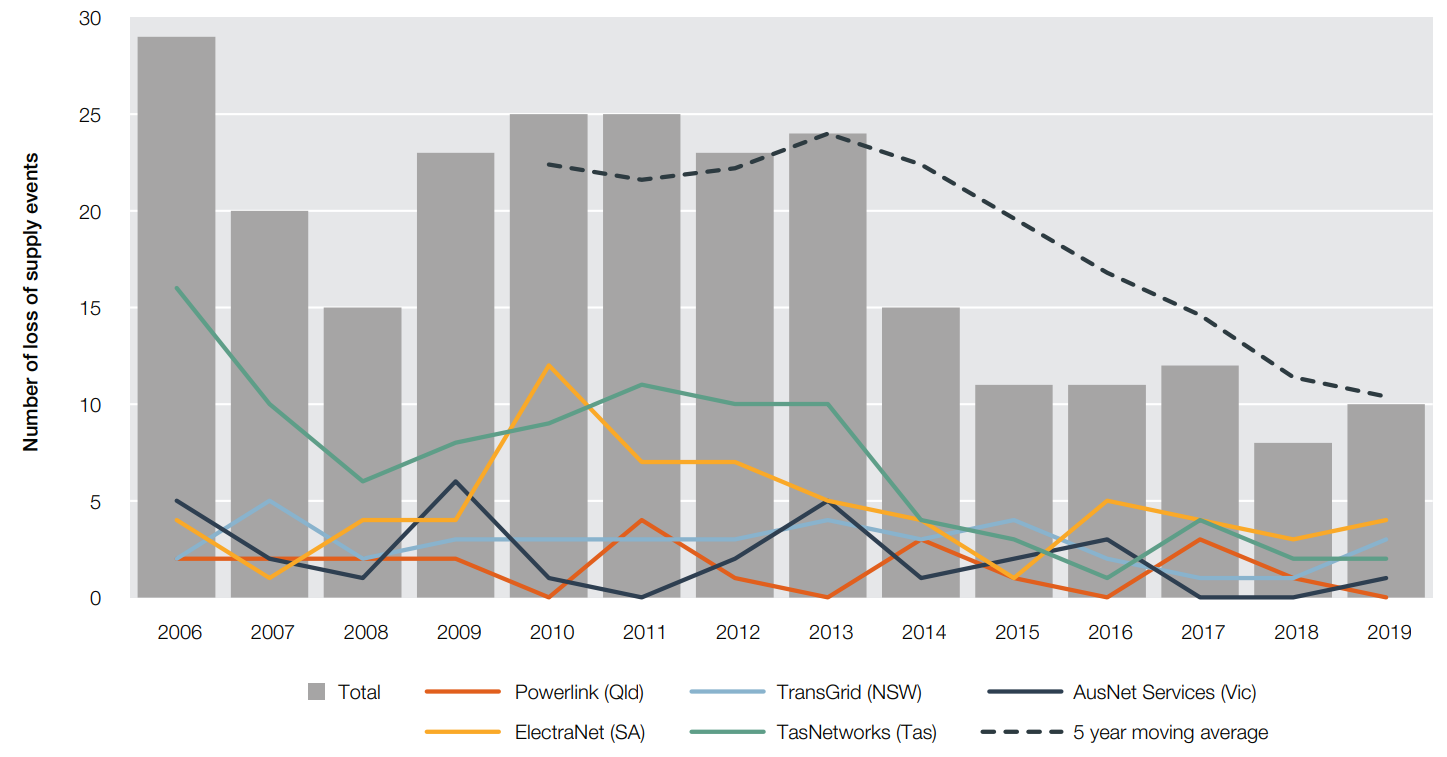
Source: Economic benchmarking regulatory information notice responses
Innovation at the centre
Continued innovation is necessary to deliver better customer outcomes in a two-way energy system. Customers are connecting their DER at rapid rates, with both the number and size of installed solar PV systems continuing to increase. DER capacity reached 11,383 MW in December 2020, making up 17 per cent of generation capacity and supplying 6.4 per cent of total NEM electricity requirements in 2020.
CSIRO and ENA have estimated that residential bills could be up to $400 lower if DER are optimised, while management consultancy firm Baringa separately estimates that direct procurement of network support services along with cost-reflective network tariffs would generate about $2.3 billion value over the next 20 years. Tariff reform will be needed to complement increasing DER capacity and support customer preferences.
The State of the Energy Market report usefully reveals that DNSP forecasts expect increasing numbers of residential customers to be assigned cost-reflective network tariffs in contestable metering jurisdictions each year.
Projected assignment of cost-reflective tariffs for residential consumers – electricity distribution networks
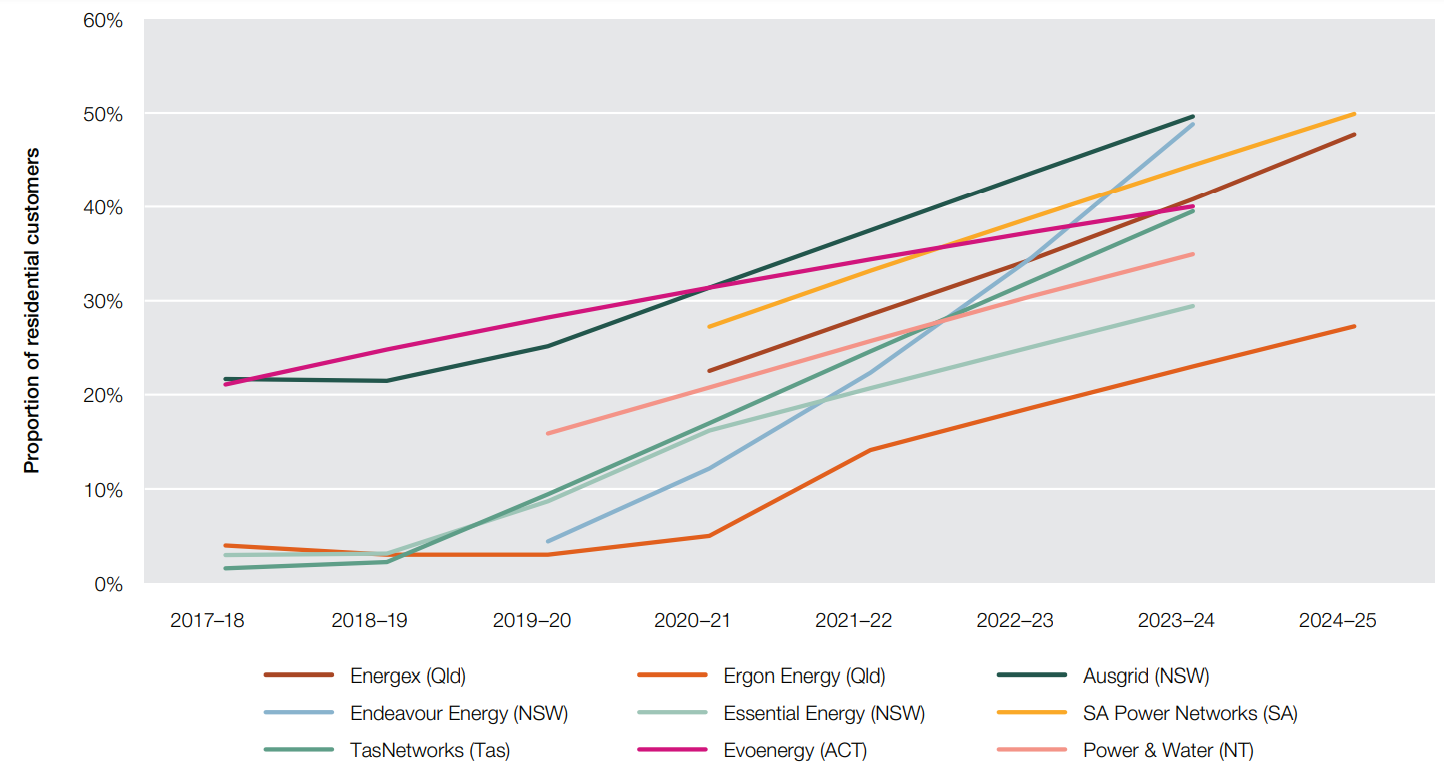
Source: AER analysis of unpublished forecasts supplied by regulated electricity distribution businesses
Take aways
The State of the Energy Market report is a useful refocusing piece to remind ourselves of the immense scale of both the assets in place and the transformation ahead, and what’s at stake for customers if we can get it right. Keeping the lights on has never had as many moving parts as it does today and coordinating them together isn’t getting easier.
It’s clear we need to get on with tariff reform and continue to enable customers to connect their DER, while also maintaining reliability and continuing to collaboratively plan to manage longer-term matters.
[i] Note: 2020 data not yet available


")