Ignoring a bath curve is a slippery slope
You are no doubt familiar with electricity’s duck curve, but have you heard about the bathtub curve? Just as important to the energy system, this curve represents the failure rates of network assets like poles and wires as they age.
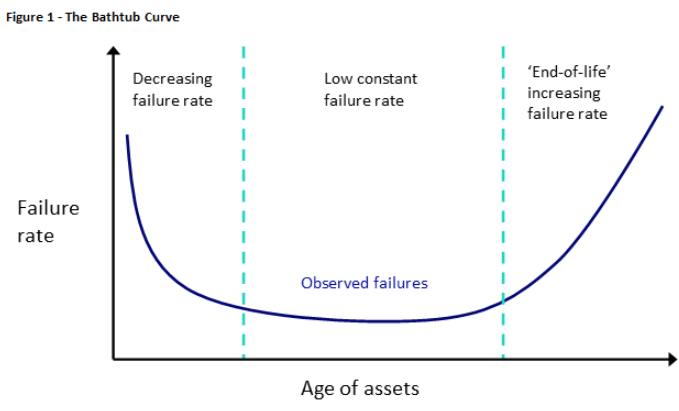
The bathtub curve’s purpose is to map the engineering failure rate over time for a group of assets.
- In the early stages of an asset’s life, assets might fail because they are defective.
- There is a period in the middle of the curve where failure is generally low.
- Finally, as assets reach their end of life, the failure rate increases because of built up wear and tear.
The curve is very applicable to electricity networks, and what an interesting story it tells.
Asset age and life expectancy
The bathtub curve is a good representation of how network assets deteriorate over time in electricity networks. Network engineering assets like substations, transformers and poles and wires often have a standard life expectancy of around 40 to 60 years[i].
It is safe to assume that when assets get to this age, they are generally more susceptible to higher failure rates due to wear and tear and they would sit in the ‘end of life’ up-slope of the curve. It is natural to replace assets when they get older to prevent outages for customers and maintain a safe and reliable network.
The problem is that the average age of poles and wires across networks is increasing. This happens because the replacement of poles and wires in networks isn’t keeping up with the 50 to 60-year life expectancy.
SA Power Networks (SAPN) is the most extreme case. Due to its investment profile during the 1950s and 1960s, the average age of its assets are now almost 45 years old and are expected to increase to almost 50 years old by 2025[ii].
Figure 2 – SAPN asset investment profile[iii]
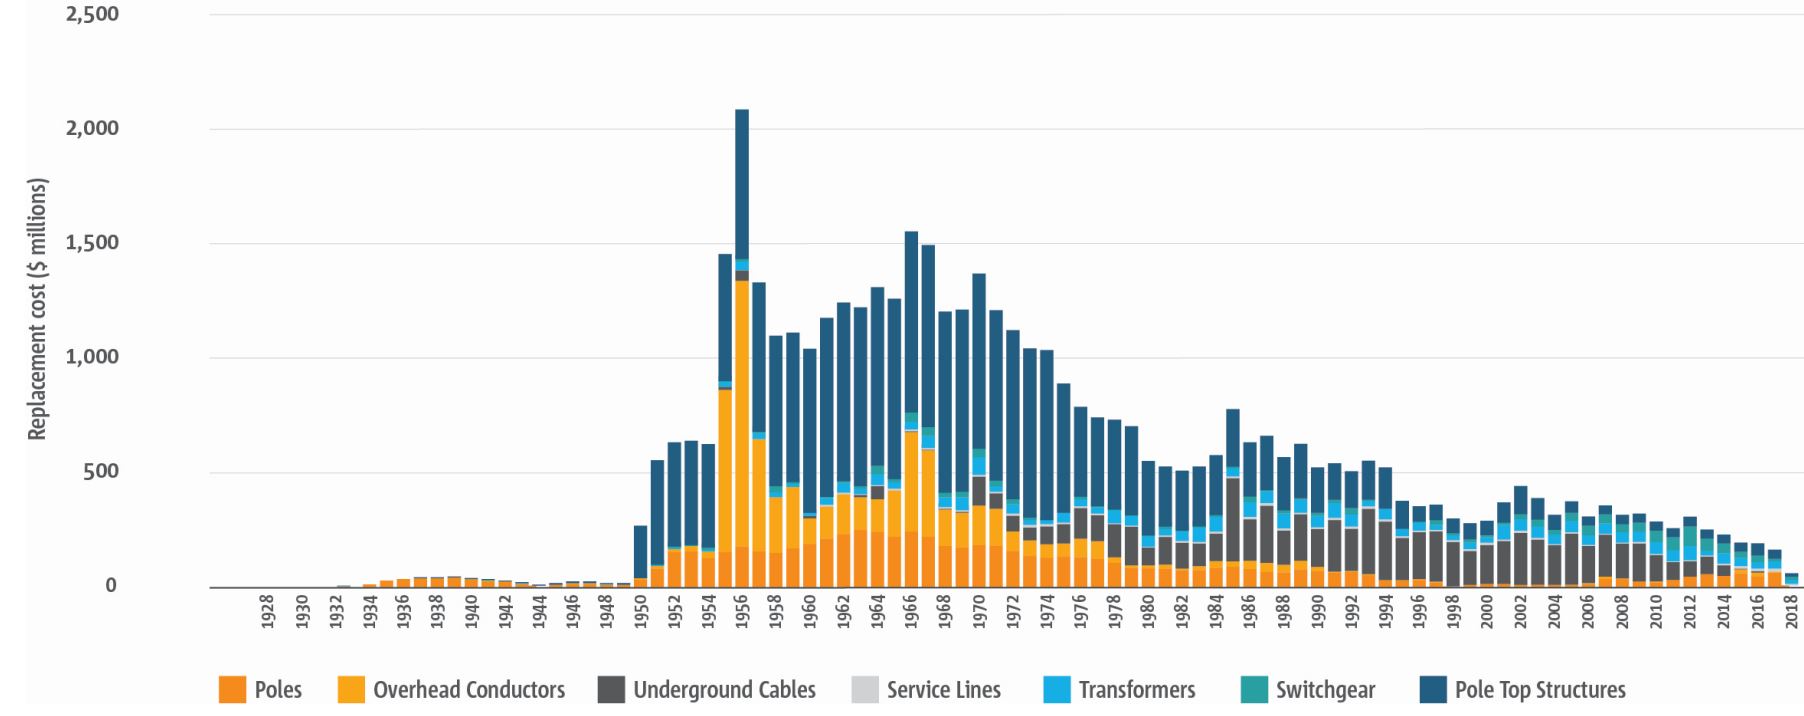
Delaying asset replacements – the necessary response to regulatory decisions that deny expenditure – could create a large wave of network investment, the cost of which is borne by future generations of customers in both power bills and more frequent outages.
The Australian Energy Regulator recently cut SAPN’s proposed replacement expenditure by 11 per cent. It says it isn’t convinced that aging assets and a large wave of investment are a problem on the basis that technology advances such as Information and Communications Technology,(ICT)and distributed energy resources (DER) reduce the likelihood of major future investment, while SAPN’s inspection practices are also effective[iv].
While it is true that poletop batteries or more advanced asset management technologies can reduce the size of required replacement expenditure because they could flatten network demand and reduce the amount of replacement required, the average age of assets is alarmingly moving up the bathtub curve. The network still needs poles and wires to move electricity from A to B and the fact is, the network is generally getting older.
Current replacement rates
SAPN estimates it is turning over assets at less than 0.5 per cent a year, implying that for this level of replacement to be sustainable going forward, average asset lives would need to be at least 200 years[v]. No network assets are designed to last for 200 years.
The story is similar for other networks. Zubin Meher-Homji at Dynamic Analysis recently published analysis that estimated annual replacement capital expenditure as a percentage of replacement cost for electricity distribution networks. At the time, asset turnover was estimated at 0.6 per cent across the National Energy Market and the Northern Territory, implying average asset lives of around 166 years[vi] (See Table 1). The analysis suggested that previously deferred replacement expenditure – from before the AER assumed regulatory responsibilities – was partly to blame for price increases in NSW network Ausgrid between 2009 and 2014[vii].
Table 1 – Replacement to replacement cost and implied asset life
| Network | Replacement to replacement cost | Implied asset life (years) |
| SAPN | 0.25% | 407 |
| TasNetworks | 0.41% | 246 |
| CitiPower | 0.46% | 216 |
| Ergon Energy | 0.47% | 211 |
| Essential Energy | 0.48% | 210 |
| Evoenergy | 0.50% | 202 |
| Powercor | 0.50% | 201 |
| Power and Water Corporation | 0.73% | 137 |
| Endeavour Energy | 0.78% | 128 |
| United Energy | 0.81% | 124 |
| Ausgrid | 0.89% | 113 |
| AusNet Services | 0.99% | 101 |
| Energex | 1.13% | 89 |
| Weighted average | 0.60% | 166 |
Onwards and upwards
Despite low replacement and very long implied asset lives, networks are not too old just yet and customers are seeing lower prices from efficiency gains and also low network replacement costs. The question is, how long can this last?
Part of the challenge is ensuring backward looking models of estimating replacement spending based on history are calibrated correctly and take into account the reality of ageing assets. An important risk to avoid is customers of the future being lumped with a disproportionate bill to refurbish the network on a mass scale while also potentially seeing lower reliability levels until replacement catches up to asset age. Innovation in ICT and DER could soften the blow, but it is unclear by how much.
The long-term interests of consumers are enshrined as the paramount objective in our energy legislation, while inefficiently suppressed replacement expenditure risks undermining stable and lower bills for future customers. Networks will continue to seek improvements and innovations in their asset management strategies to prolong lower network prices, but more asset replacement will be required as networks face and address the bathtub curve.
[i] The AER recently accepted CitiPower’s Draft Determination on 49 year asset lives for distribution system assets and 50 year lives for subtransmission assets: AER, Draft Decision CitiPower 2021-2026 Attachment 4 Regulatory Depreciation (2020) and AusNet Services’ Draft Determination on 45 year asset lives for subtransmission and 50 year asset lives for distribution system assets: AER, Draft Decision AusNet Services 2021-2026 Attachment 4 Regulatory Depreciation (2020).
[ii] SAPN, Attachment 5 Capital expenditure, 2020-25 Revised Regulatory Proposal (December 2019), p. 20.
[iii] SAPN, Attachment 5 Capital expenditure, 2929025 Regulatory Proposal (January 2019), p. 30.
[iv] AER, Final Decision, SA Power Networks Distribution Determination 2020 to 2025, Attachment 5 Capital expenditure (June 2020) p. 18.
[v] SAPN, Attachment 5 Capital expenditure, 2020-25 Revised Regulatory Proposal (December 2019), p. 21.
[vi] Analysis based on system value implied by audited information provided to the AER on replacement age profiles and unit costs. An important nuance is that the Regulatory Asset Base is the value of the network for regulatory purposes after depreciation and is not a good indicator of the cost to replace physical network assets. The actual cost of replacing a network is much higher than the Regulatory Asset Base. More information available here: Zubin Meher-Homji, Boomerang Price Shocks in Electricity (September 2020), p. 76.
[vii] Zubin Meher-Homji, Boomerang Price Shocks in Electricity (September 2020), p. 62.

