Reliable and ever more renewable: AER State of the Energy Market 2022 Report
The Australian Energy Regulator (AER) has recently released its annual State of the Energy Market report, providing an overview of each part of Australia’s energy sector. The report finds that network charges are at their lowest levels in a decade, consumers continue to benefit from improving reliability, and that the grid is rapidly heading to a more interconnected, and distributed future which looks different from the recent past.
Network charges lowest in a decade
As shown in Figure 1 below, a typical residential electricity retail bill is made up several cost components – the wholesale costs of electricity, network costs for transporting electricity, environmental scheme costs, and retail costs and margin.
Electricity network charges typically account for 40-50% of customer electricity retail bills. Crucially, network charges are the lowest they’ve been in over 10 years, which has helped mitigate some of the pressure on the retail bills that customers are increasingly faced with.
Figure 1: Composition of residential electricity bill
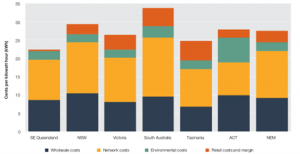
Source: Figure 6.2, AER 2022 State of the Energy Market Report
Reliability continuing to improve
Even with networks costs down, reliability is still improving, highlighting how the AER’s incentive-based system is delivering for customers.
Reliability refers to electricity networks providing uninterrupted supply of electricity to customers and is the main focus of distribution network performance. In 2020-21, customers not only experienced a reduction in the total number of unplanned (normalised) interruptions to supply, but they also experienced a reduction in unplanned (normalised) minutes off supply, as shown in Figures 2 and 3 below. This improvement has occurred against a backdrop of material reductions in capital expenditure over the past decade.
Figure 2: Electricity distribution networks – interruptions to supply per customer
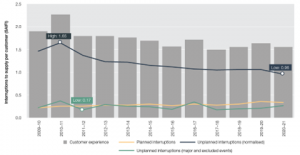
Figure 3: Electricity distribution networks –minutes off supply per customer
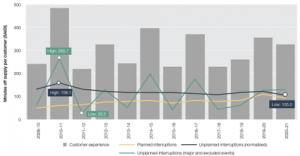
Source: Figures 3.40 and 3.41, AER 2022 State of the Energy Market Report
However, the ultimate reliability that a customer experiences (as shown by the ‘customer experience’ bars in the figures above) has been less consistent over the decade and is greatly impacted by severe weather events.
This signifies the need for a resilient network focused on actual customer experiences and priorities, especially with climate change expected to significantly increase the occurrence and intensity of natural disasters.
The Electricity Networks: A guide to climate change and its likely effects produced by ENA earlier this year outlines the expected climate in each state for networks to develop plans of action. Electricity networks in NSW, ACT, TAS and the NT also recently collaborated on a Network Resilience paper as part of their current regulatory reset engagement, seeking to ensure that the network is fit for purpose and can adequately respond following natural disaster events in a changing climate.
A distributed energy future
Renewable energy generation continues to grow with renewable output in the national electricity market (NEM) accounting for 25% of total grid generation in 2021. Rooftop solar is also achieving new milestones with energy generation across the NEM reaching 10GW in December 2021. Rooftop solar has a capacity of 14GW as of January 2022, making it the second largest fuel type after black coal.
As mentioned in the Australian Energy Market Operator’s (AEMO) Statement of Opportunities report[i], 68% of capacity from future projects planned until 2024-25 are variable renewable energy generation projects and 26% are storage projects, signifying a growing share of renewable energy in the grid, particularly in NSW as shown in Figure 4.
Figure 4: Fuel source of future projects planned until 2024-25 by capacity
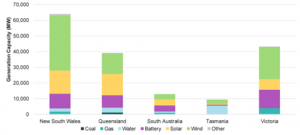
Source: Figure 17, AEMO Statement of Opportunities
Networks hold the key to delivering customers a secure, reliable and affordable transition to renewables. AEMO’s 2022 Integrated System Plan[ii] highlights the need for an additional 10,000kms of transmission lines, with this new transmission enabling more low-cost generation to connect to the grid and ensuring system security and reliability as variable renewable generation increases.
Rising instances of rooftop solar generation reduces the demand for energy from the grid and has contributed to NEM minimum grid demand declining in 2021 to its lowest level since Tasmania joined the NEM in 2005.
This trend is expected to continue with AEMO expecting the lowest level of grid demand to switch from the middle of the night to the middle of the day, when rooftop solar generation is at its highest, within the next five years[iii]. Distribution networks are increasingly incorporating cost-reflective tariffs to encourage energy usage during the day when demand is low and generation from solar is high, with an increase to the current smart meter penetration essential to deliver widespread tariff reforms.
Networks capital investment
Network assets undergo a bathtub curve, meaning there are more chance of failures at the very start of their asset life due to potential design defects and then an increase to the failure rate at the end from built up wear and tear. As such, there is a constant need for replacement investment across any established network.
As shown in Figure 5, replacement investment has largely been the more significant capital investment type for transmission networks. However, in 2021 growth expenditure was the leading driver for the first time since 2012. The need for an expansion in transmission networks to integrate renewables has contributed to an uptick in growth investment projects in 2021, with TransGrid and ElectraNet’s Project EnergyConnect a significant driver of the switch in 2021.
Figure 5: Capital investment – electricity transmission networks
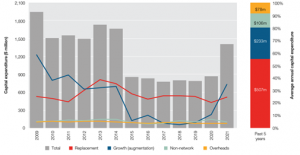
Source: Figure 3.24, AER 2022 State of the Energy Market Report
As shown in Figure 6, replacement investment continues to be the main driver of capital investment in distribution network since 2014, with the growth, non-network and overheads capital expenditure types accounting for similar shares of capital investment since 2018.
Figure 6: Electricity distribution networks capital investment
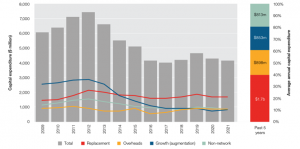
Source: Figure 3.25, AER 2022 State of the Energy Market Report
As demonstrated in the AER’s report, networks have continued to improve reliability despite the ever-changing composition of energy in Australia. Moreover, this has been done while average network charges have declined, highlighting that in a time of dynamic market changes networks continue to be the most stable part of the energy supply chain.
[i]AEMO 2022 Statement of Opportunities, page 42
[ii] AEMO 2022 Integrated System Plan, page 12
[iii] AEMO 2022 Statement of Opportunities, page 25


