Network report card: more bang for your buck
The Australian Energy Regulator releases an aggregate set of metrics for network businesses each year which gives a useful snapshot of trends in how the industry is performing. The data set comprises all electricity network businesses in all Australian states except WA.
We recently looked at the transmission metrics, showing that costs are down and benefits are up. The distribution metrics have since emerged into the public domain and illustrate that distribution networks are no different. Customers are paying less for network services and getting more ‘bang for their buck’.
Customers, usage and prices
A starting metric for assessing trends for customers and network businesses is revenue. Revenue in 2018 is down more than five per cent from 2017 figures, declining from $10.29 billion in 2017 to $9.76 billion for the year. The aggregate reduction of more than 5 per cent is substantial because it represents how much money has been recovered from customers to provide distribution services throughout the year.
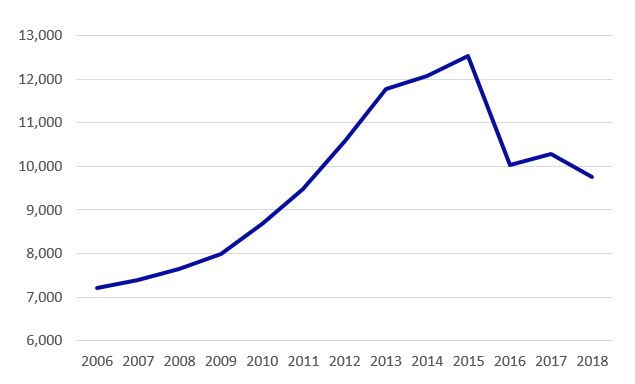
Figure 1 – Distribution Network Revenue ($m 2018)
It’s good news for customers because in aggregate that’s a reduction of $68 per customer in 2018 compared with 2017. The trend of lower revenues is continuing after a peak of $12.5 billion in 2015.
Distribution networks experienced a net increase of 165,000 new customers in 2018, raising the total number of customers by 1.6 per cent to 10.29 million.
Despite this increase in customers, the total energy delivered was down 0.6 per cent to 144,100 GWh. Energy delivered was in decline until 2014, after which it rebounded slightly. It has since plateaued even though forecasts expected a more than 3000 GWh increase from 2017 to 2018.
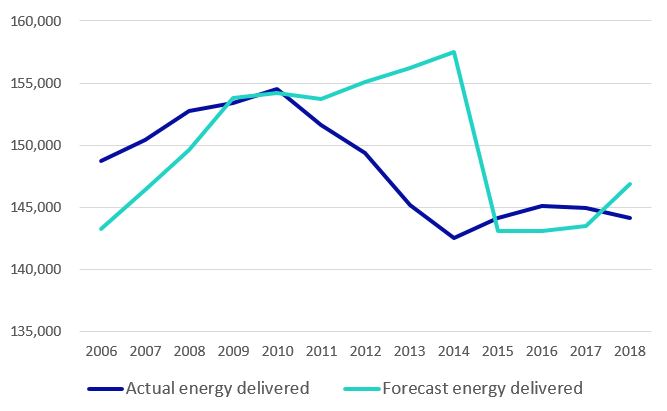
Figure 2 – Energy Delivered (GWh)
The energy delivered results reflect that households and businesses continue to lower their average annual electricity consumption.
After accounting for the 1.6 per cent increase in customers and the 0.6 per cent decrease in total usage, aggregate distribution services prices decreased by more than six per cent. This is good news for customers.
Customers are using less electricity, either through improving their energy efficiency or making different choices about their energy, use while paying less on a per kWh basis for network services.
It is important to emphasise that distribution charges are only a portion of a customer’s total bill and although distribution charges are falling, customers should shop around to ensure they are getting the benefit of this.
Network snapshot
The list of useful financial and non-financial metrics doesn’t stop there.
The Regulatory Asset Base, which represents the value of network assets, increased less than the Australian Energy Regulator’s forecast from 2017 to 2018 and declined on a per customer basis. The Regulatory Asset Base is trending to stability after historic investment and growth in capacity following changes to government reliability standards and demand forecasts.
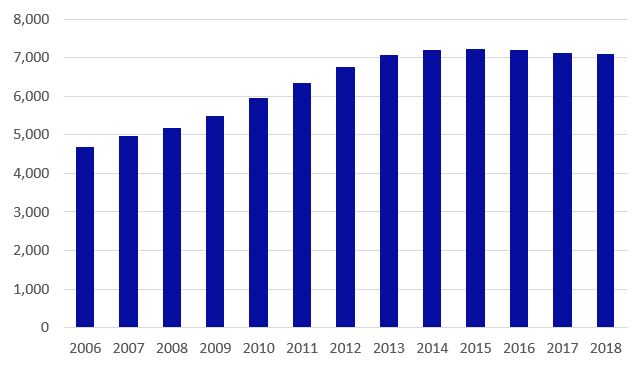
Figure 3 – Average Distribution Network Regulatory Asset Base per customer ($ 2018)
Capital expenditure (Capex) represents investment in distribution networks, including replacement and refurbishment of poles, wires and infrastructure, which directly feeds into the Regulatory Asset Base. Capex increased by $350 million to $4 billion but is still far lower than the peaks of the past.
The Australian Energy Regulator’s Annual Benchmarking Report found that in 2017, electricity distribution businesses increased total productivity by 2.7 per cent with operating expenditure (Opex) improvements contributing 1.4 per cent[1]. Opex improvements were realised in 2018 with a 4 per cent reduction to $3 billion, continuing the trend of declining Opex since 2012.
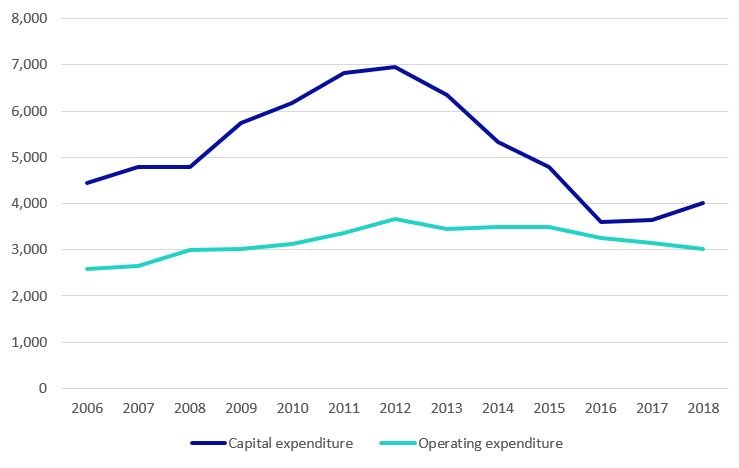
Figure 4 – Distribution Network aggregate Capex and Opex ($m 2018)
Network businesses get to keep some of the benefits of outperforming expenditure targets while customers receive most of the reward. Energy Networks Australia’s Rewarding Performance report showed that incentive schemes are rewarding customers with even more financial benefits than were anticipated when the schemes were designed, due to lower than expected interest rates.
Reliability levels slightly declined with customers averaging 110 minutes off supply compared with 107 minutes in 2017. Still, 2018 figures are the second-best on record for distribution networks, only surpassed by standout 2017 figures.
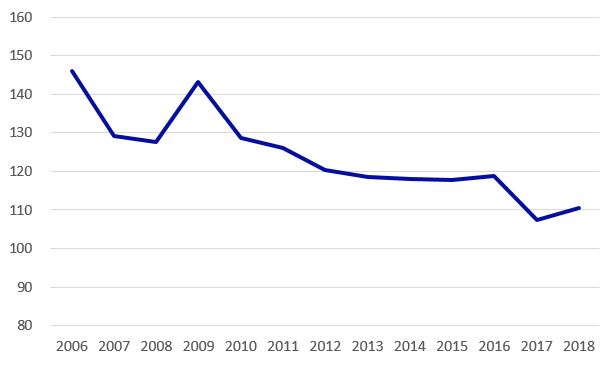
Figure 5 – Customer weighted average annual minutes off supply
The network utilisation rate, a simple measure of maximum demand compared with the capacity of the network, was up two per cent on 2017 rates, indicating that the network is being better used. An additional 2,000 kms of wires were also added to the grid, bringing the total length up to 747,000 kms – enough to circle the globe more than 18 times or connect the moon to the National Energy Market twice over.
Interestingly, the increase in wires has solely been due to more undergrounding. The total length of overhead wires in 2007 was 633,553 kms, while in 2018 there were 633,536 kms, a decrease of only 17kms over eleven years. Meanwhile in the same period, there has been an additional 35,000kms of wiring placed underground. Undergrounding assets is more expensive up-front but requires less on-going maintenance and delivers improved amenity, safety and reliability.
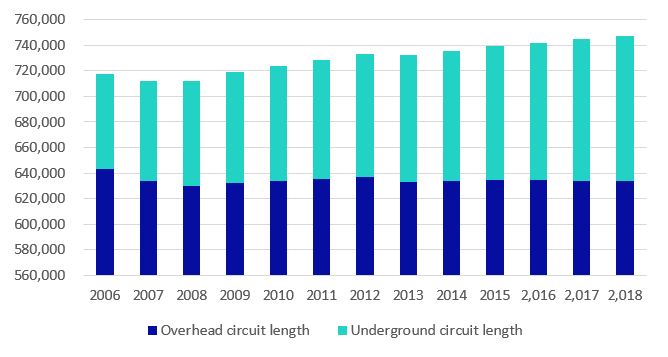
Figure 6 – Length of Distribution Network wires in the NEM (km)
Pieces coming together
The trend of customers paying less for network services is welcome. Combined with better utilisation, lower operating costs and necessary investment, distribution networks continue to balance customer concerns for lower prices against the provision of reliable service and a network that will continue to be valued into the future.
Better wholesale competition, enabled by transmission infrastructure and an active demand response market, will help ease electricity costs without a trade-off in reduced reliability. Customers have the right to a high-quality network service. Every connection affects lives. For many it might be the most important service they receive.
Although responsibility for the quality of service and associated network charges sits with the network, customers have some control over the retail price paid. But not all customers have the capability to get the best offer. Customers should be helped by their retailer to transition to better energy deals as they become available. This will ensure that the benefits of strong past and future performance of distribution networks continue to flow to customers.
[1] Australian Energy Regulator, Annual Benchmarking Report, Electricity distribution network service providers (2018), p. 10.

