Networks productively delivering for customers
Australian network businesses have achieved record breaking productivity improvements in 2016-17, outstripping gains in the utilities sector and the broader economy. What are the drivers of these gains and how are customers benefitting? We take a look at economic benchmarking and what it’s telling us.
It’s never been clearer that energy businesses should be continuing to find ways of doing more with less as customers continue to feel the pressure of energy and other cost of living stresses. The latest economic benchmarking reports published last week by the Australian Energy Regulator present hard evidence that network businesses are pulling their weight.
Distribution networks’ overall productivity increased 2.7 per cent in 2016-17 while transmission networks increased their productivity by a record breaking 5.8 per cent.
- The productivity of distribution businesses is on the rise for a second year in a row, while transmission businesses had the largest productivity increase in the measure’s recorded history.
- Productivity increases are great for customers as it essentially means more services are being provided at lower cost which translates to lower bills.
- The results are a clear indication that incentive regulation is working as networks have clearly pushed hard to deliver value to customers.
What is economic benchmarking and why does it matter?
Economic benchmarking is when the relative efficiency of a business is tracked across time to see how efficient the business is operating relative to other businesses or industries. In addition to providing information to customers, networks and regulators, the results can drive continuous business improvements and better future decision-making.
The electricity distribution[1] and electricity transmission[2] reports contain analysis of network productivity since 2006. A weighted average set of inputs and outputs is taken each year to determine overall productivity, measured as the level of output relative to how many inputs were used.
The inputs are the capital assets which networks have built over time and any particular year’s operating expenditure, while outputs are customer numbers, the length of cables, the highest demand recorded on a network, total energy delivered and minutes off supply (reliability). A measured productivity increase is when a network can deliver more outputs for a given amount of inputs or when the same outputs can be delivered at a lower cost.
More outputs, fewer inputs
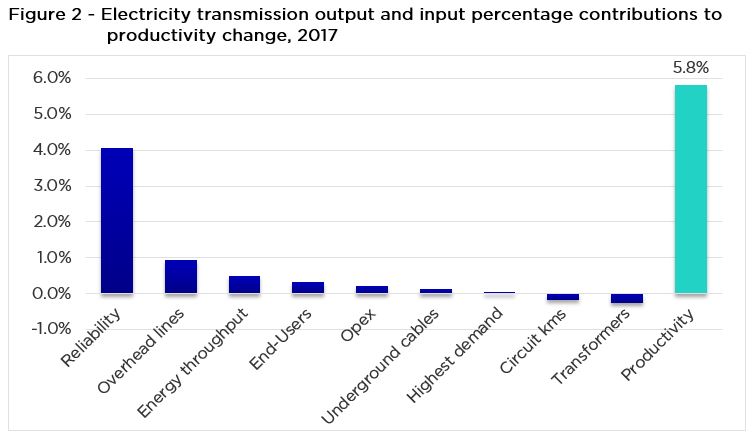
These graphs show the areas where productivity gains were made, totalling 2.7 per cent in distribution businesses and 5.8 per cent in transmission networks.
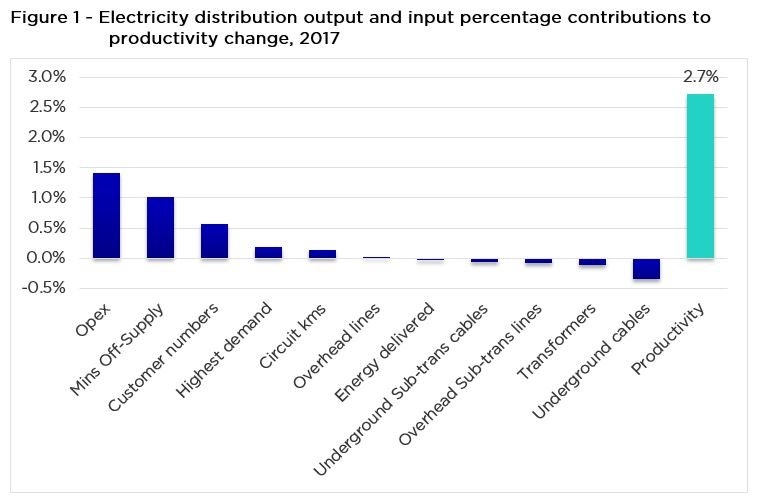
Distribution businesses delivered higher reliability and more customer connections all while incurring lower operating expenditure than in the previous period. Customer numbers, maximum demand on the network and the total length of cables also increased. A reduction in the amount of cables deployed underground was counted as the largest detriment to productivity, though there are often complicated outside drivers impacting this factor.
Large reliability gains spearheaded improvements for both segments but particularly for transmission businesses. For every nine minutes off supply attributable to transmission members in the 2016 period, only one minute was recorded in the 2017 period, an 89 per cent improvement. Transmission networks also increased their length of lines, number of end-users and energy throughput.
Across the board, networks have delivered more outputs, all while using fewer inputs, the very definition of doing more with less.
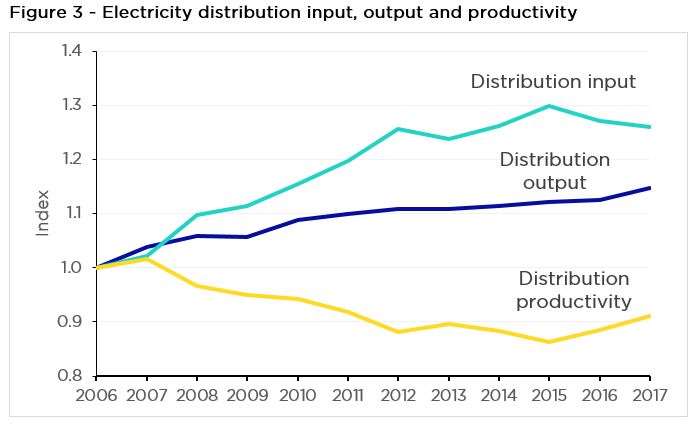
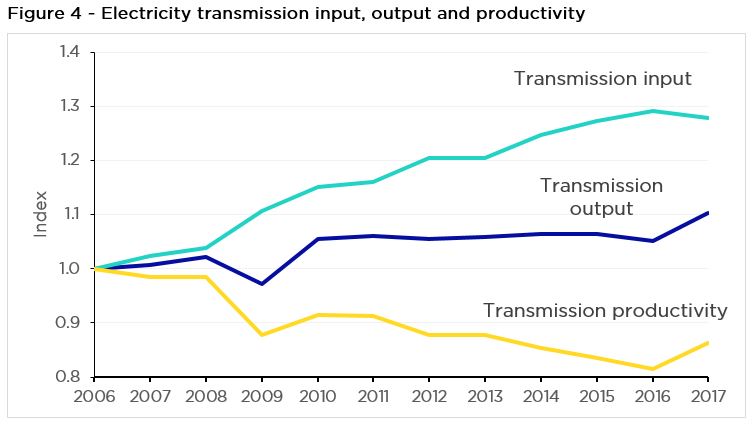
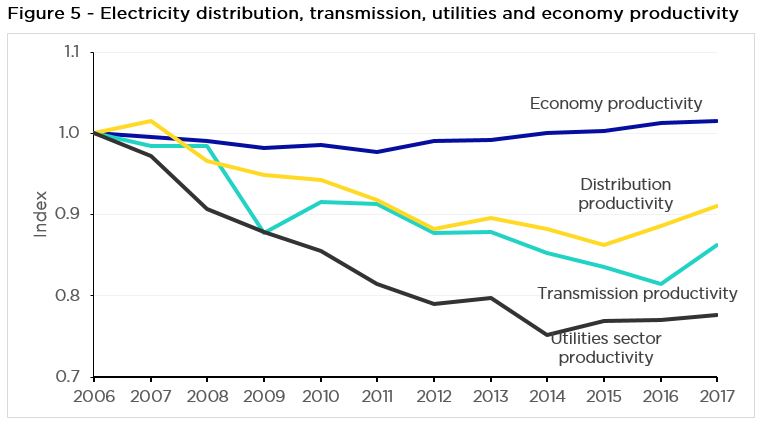
The end of the declining trend
The declining trend in productivity experienced over the past ten years is noteworthy. The electricity network sector has undergone significant change and been affected by new mandated reliability requirements over this period. With the focus increasingly turning from traditional efficiency metrics to an integrated, customer-centric network with increasingly two-way energy flows. An issue for the future is that some of the traditional output measures used for economic benchmarking don’t necessarily reflect this world as well as past metrics. For example, an increasing element of networks’ value to customers is enabling good access to markets from distributed solar and battery storage technologies.
Electricity networks have still been one of the better performers across all utility sectors, maintaining relatively higher productivity levels since 2006.
Network businesses also face other obligations which add value to the community, but that value is not necessarily reflected in the output measure. A good example is the infrastructure upgrades which networks have made to reduce the risk of bushfires. The AER has recognised that regulatory obligations may contribute to some of the decrease in productivity[3].
Record-breaking productivity gains in this most recent report demonstrate that the regulatory framework is working in customers’ interests, as networks bring down costs and increase services. Incentive regulation ensures that about 70 cents of every operating dollar saved gets returned to customers over time. Improvements in the name of customer outcomes are rightly becoming the norm for networks as they strive for best practice.
[1] Australian Energy Regulator (2018) Annual Benchmarking Report – Electricity distribution network service providers
[2] Australian Energy Regulator (2018) Annual Benchmarking Report – Electricity transmission network service providers
[3] Australian Energy Regulator, Electricity distribution network service providers Annual benchmarking report (2014), p. 29.


