Why energy company profits can be a surplus for customers
With accusations of ‘price-gouging’ running rife, just how much profit network businesses are making is being reviewed by the Australian Energy Regulator. The AER is developing a range of network profitability measures – the first one being ‘return on assets[1]’ – which compare profitability between each electricity distribution and transmission business. We provide a snapshot analysis of network businesses’ return on assets as reported by the AER this week, which demonstrates how incentive regulation is helping bring power prices down.
Network businesses have the ability to earn returns above or below the allowed cost of capital, depending on how well they are able to deliver cost savings and beat the benchmarks set by the regulator. This is called incentive-based regulation. The numbers show that over the past four years, networks have been delivering efficiency gains that are leading to lower power prices for customers. AEMC data shows network charges for the average Australian household have fallen by $83 since 2014-15.
The AER emphasises care should be taken when interpreting the differences between its reported return on assets measures and allowed returns, which can be caused by a number of one-off factors, as well as timing issues.
For example, the data may give a false impression about profitability due to higher than expected demand and therefore, higher revenue in one year. However, the extra revenue earned will be subtracted from allowed revenues the following year. Thus, the reported measures for either year do not reflect the actual performance.
Initial observations and trends
When determining network profitability, the AER sourced publicly available data, including regulatory information, from 2013-14 to 2016-17.
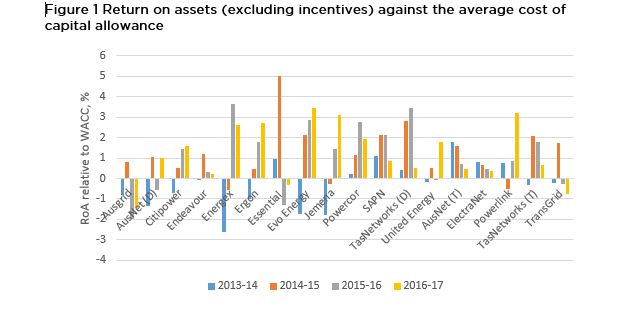
The data shows that since 2013 many, but not all, electricity businesses have been able to uncover significant cost and operational efficiencies and beat regulatory performance benchmarks on a return on assets basis (Figure 1).
However, return on assets were extremely volatile over the observed period, as expected under the incentive-based regulation. This also reinforces the caveats noted by the AER on the factors that can result in year-on-year variances in the ratios.
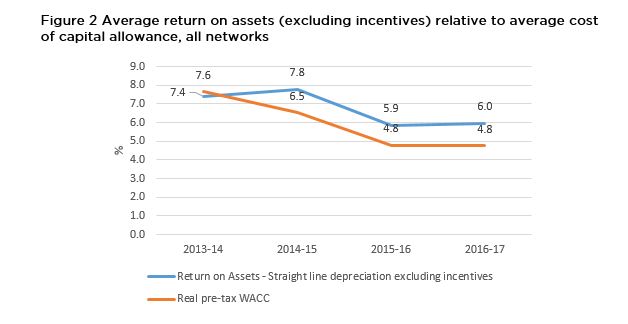
On average, electricity networks have outperformed the benchmark cost of capital[2] set between 2014-15 and 2016-17 (Figure 2). Overall, the returns on assets for network businesses have fallen over the past four years by almost 20 per cent.
The data shows that real pre-tax cost of capital allowances have fallen by 38 per cent between 2013-14 and 2016-2017. The return on assets results are highly correlated with the fall in real cost of capital allowances, pointing to the significant impact of reductions in cost of capital already made over the past five years.
Encouraging network efficiencies means customers benefit through lower prices
Noting the limitations and caveats outlined in the AER’s report, the data shows that, on average, network businesses delivered a return on assets slightly above the real cost of capital allowance set by the regulator.
But does it mean that networks are earning excessive profits? The short answer is no – let’s explore the key concepts.
It is normal and intended for businesses to seek efficiencies to outperform (i.e. be more profitable than expected). Under incentive-based regulation, the benefits of efficiency improvements are passed to customers through lower prices over time. This is because the regulator uses this information to set tougher benchmarks at the next price review – and for every dollar of efficiency gains kept by the business, more than two dollars flows to customers.
So it’s in customers’ interest for networks to outperform regulatory benchmarks. They don’t pay more in the short-term as revenues are locked in for five years and the incentives created help drive lower ongoing costs and continuously improved regulatory decisions on benchmarks into the future. This leads to ongoing savings to customers. It’s a long way from gouging.
Networks generally face lower risks than an average firm, but this is not the same as bearing no risk. Networks remain deliberately exposed to a range of risks as part of incentive regulation. For example, a network business would not receive additional revenue during a regulatory period if its expenditure was higher than the forecast efficient expenditure allowance set by the regulator. The network business also bears the risk that actual financing costs may be higher than the cost of capital allowance provided by the regulator and it cannot pass those higher costs on to consumers.[3]
On initial analysis, most if not all of the difference between the real cost of capital allowance and the AER’s return on assets measures can be accounted for by either expenditure outperformance by the businesses or by the specific incentive payments allowed by the AER. In both cases, these benefits of superior performance are passed on to consumers and information revealed by this performance helps drive better decisions going forward.
It is an indication that the regulatory framework is working effectively when higher levels of profitability are recorded because regulated businesses are responding to efficiency and service quality incentives.
Next steps
The return on assets is only one of five profitability metrics that the AER is expected to develop. Network businesses recognise consumers need meaningful measures to be used in a timely way and the AER’s current process represents a positive opportunity for getting it right.
We support close collaborative consultation between consumer groups, network business representatives, the AER and its advisors. This approach has the best chance to ensure workability and maximum robustness around the collection and publication of profitability measures.
[1] The AER calculates return on assets as Regulatory EBIT / RAB, where EBIT is Earnings before interest and tax and RAB is Regulatory Asset Base.
[2] The pre-tax real cost of capital is an estimate of efficient financing costs for a benchmark efficient entity providing regulated services. The pre-tax real cost of capital shown in any one regulatory year includes the rates of return determined by the AER in different time periods. These determinations being made in different years are affected by changes in market-based parameters.
[3] AEMC, Electricity network economic regulatory framework review 2018, Final report, July 2018, p11.
.jpg-autosave")
